Label Applicators Market Size
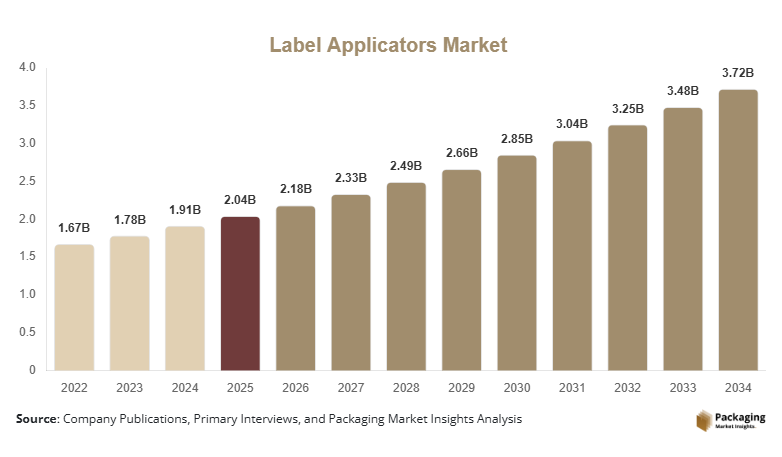
The label applicators market size is projected at USD 2.18 billion in 2026 and is expected to hit USD 3.72 billion by 2034 with a CAGR of 6.9%. Rising investments in automated packaging lines, demand for traceability, and increasing production capacities across manufacturing industries continue to accelerate market expansion. The report provides detailed segmentation by type and application while evaluating production trends, technology adoption, regional demand patterns, and the competitive landscape supporting long-term industry development.
The Label Applicators Market comprises equipment designed to automatically or manually apply pressure-sensitive, shrink sleeve, wrap-around, and specialty labels to bottles, cartons, containers, pouches, and industrial packages. Global production exceeded 845,000 units during 2025, while automated systems represented nearly 61% of total installations. Food & beverage accounted for approximately 41% of equipment demand, pharmaceuticals contributed 22%, and consumer goods represented 19%, with the remaining 18% distributed across logistics, chemicals, and industrial packaging. Adoption of Industry 4.0-enabled labeling solutions surpassed 38% among large manufacturing facilities, reinforcing the label applicators market.
Explore more data points, trends and opportunities Download Free Sample Report
Label Applicators Market Trends
Trend: Expansion of Smart and High-Speed Labeling Systems
Manufacturers are increasingly integrating vision inspection, servo-driven motors, and IoT-enabled diagnostics into labeling equipment. High-speed applicators capable of processing 700–1,200 containers per minute represented nearly 46% of newly installed systems in 2025. Annual production of intelligent applicators exceeded 295,000 units, while predictive maintenance adoption increased to 34% among large production plants. These developments continue to reshape the label applicators market.
Growing sustainability initiatives are encouraging linerless labels, recyclable substrates, and reduced adhesive consumption. More than 43% of newly commissioned packaging facilities incorporated energy-efficient applicators during 2025, reducing electricity consumption by approximately 18% per production line. Demand from e-commerce fulfillment centers expanded by 11.8%, while pharmaceutical serialization projects increased equipment installations by 9.6%, strengthening the label applicators market.
Label Applicators Market Drivers
Rapid Automation Across Packaging and Manufacturing Industries
Industrial automation continues to drive equipment modernization as manufacturers seek higher throughput and labeling accuracy. Automated packaging lines increased by 12.4% during 2025, while global packaged product output surpassed 8.9 trillion units. Label placement accuracy exceeding 99.8%, production efficiency improvements of 24%, and labor cost reductions approaching 28% have accelerated investments across food processing, beverages, pharmaceuticals, and consumer goods, supporting continuous expansion of the label applicators market.
Label Applicators Market Restraints
High Initial Investment and Integration Complexity
Advanced labeling systems require significant capital expenditure ranging between USD 45,000 and USD 320,000 depending on production capacity. Installation downtime may extend 3–8 weeks, while system integration costs account for nearly 14% of total project expenditure. Small and medium-sized manufacturers still rely on semi-automatic systems, representing nearly 37% of total installed equipment, limiting faster adoption across emerging economies within the label applicators market.
Label Applicators Market Opportunities
Growing Demand for Smart Packaging and Product Traceability
Expansion of QR code labeling, RFID integration, and digital product authentication is creating substantial opportunities. RFID-enabled labeling equipment shipments increased by 16.3%, while digital serialization installations expanded by 13.5% in 2025. More than 58% of pharmaceutical manufacturers upgraded labeling infrastructure to comply with regulatory requirements, while logistics companies increased automated labeling investments by 15%, generating new opportunities across the label applicators market.
Challenges in Label Applicators Market
Supply Chain Volatility and Skilled Workforce Availability
Electronic component shortages increased equipment lead times by nearly 18%, while industrial automation engineers remained in short supply across several manufacturing regions. Nearly 26% of packaging companies reported commissioning delays, and replacement component prices increased by 9% during 2025. Maintaining operational efficiency while managing higher maintenance requirements remains a challenge for the label applicator market.
Report Scope
| Report Metric | Details |
|---|---|
| Market Size in 2025 | USD 2.04 Billion |
| Market Size in 2026 | USD 2.18 Billion |
| Market Size in 2034 | USD 3.72 Billion |
| CAGR | 6.9% (2026-2034) |
| Base Year for Estimation | 2025 |
| Historical Data | 2022-2024 |
| Forecast Period | 2026-2034 |
| Report Coverage | Revenue Forecast, Competitive Landscape, Supply Chain Disruption, Growth Factors, Environment & Regulatory Landscape and Trends |
| Geographies Covered | North America, Europe, APAC, Middle East and Africa, LATAM |
| Countries Covered | U.S., Canada, U.K., Germany, France, Spain, Italy, Russia, Nordic, Benelux, Rest of Europe, China, South Korea, Japan, India, Australia, Singapore, Taiwan, South East Asia, Rest of Asia-Pacific, UAE, Turkey, Saudi Arabia, South Africa, Egypt, Nigeria, Rest of MEA, Brazil, Mexico, Argentina, Chile, Colombia, Rest of LATAM |
Explore more data points, trends and opportunities Download Free Sample Report
Label Applicators Market Segmentation
The market is segmented according to equipment type and end-use applications. Automatic systems contributed approximately 61% of total revenue during 2025, while food & beverage applications accounted for nearly 41% of industry demand due to high-volume packaging operations.
By Type
Automatic systems accounted for approximately 61% of the market, with annual production exceeding 515,000 units. These machines support servo-controlled operation, label verification cameras, barcode inspection, and speeds exceeding 1,000 labels per minute, making them suitable for high-volume manufacturing.
Semi-automatic equipment represented nearly 25% of total demand and produced approximately 210,000 units annually. These systems provide production capacities ranging from 20–120 units per minute, making them ideal for SMEs requiring flexibility and moderate throughput.
Manual applicators contributed around 14% of market revenue with annual shipments exceeding 120,000 units. They are commonly used for low-volume production, specialty packaging, artisan products, and laboratory applications requiring portable labeling solutions.
By Application
Food & Beverage
Representing nearly 41% of total installations, food & beverage manufacturers processed over 4.5 trillion packaged products annually. Label applicators support nutritional labeling, barcode printing, expiry coding, tamper evidence, and product traceability across bottles, cans, cartons, and flexible packages.
Pharmaceuticals
The pharmaceutical segment accounted for approximately 22% of demand, processing more than 1.8 trillion medicine packages annually. Serialization compliance exceeding 96%, precise label positioning, and inspection systems enhance patient safety and regulatory compliance.
Consumer Goods
Consumer goods represented around 19% of equipment demand, supporting cosmetics, personal care, household chemicals, and retail packaging. Production exceeded 980 billion packaged products annually, while automated labeling penetration reached approximately 48% among large manufacturers.
Label Applicators Market Segmentations
Type
- Automatic Label Applicators
- Semi-Automatic Label Applicators
- Manual Label Applicators
Application
- Food & Beverage
- Pharmaceuticals
- Consumer Goods
Label Applicators Market Regional Outlook
North America
North America accounted for approximately 34% of global revenue, producing nearly 255,000 labeling systems annually. The United States contributed more than 79% of regional demand, supported by pharmaceutical manufacturing, food processing, and logistics automation. Canada expanded industrial automation investments by 8.2%, strengthening regional production.
Europe
Europe represented nearly 29% of market revenue. Germany, Italy, France, and the United Kingdom collectively generated more than 68% of regional equipment production. Food packaging, beverage bottling, and cosmetics manufacturing remained primary end users, while smart factory adoption exceeded 42%.
Asia-Pacific
Asia-Pacific held approximately 28% of the market and recorded the fastest expansion. China contributed 46% of regional manufacturing capacity, followed by Japan, India, and South Korea. Packaging production exceeded 3.8 trillion consumer products annually, supported by increasing industrial automation and export-oriented manufacturing.
Latin America
Latin America accounted for nearly 5% of global revenue. Brazil and Mexico represented more than 67% of regional demand, driven by food processing, beverage production, and pharmaceutical packaging investments.
Middle East & Africa
The Middle East & Africa contributed approximately 4% of total revenue. Saudi Arabia, the UAE, and South Africa remained key manufacturing hubs, supported by expanding packaged food production and industrial diversification initiatives.
Top Players In The Label Applicators Market
- HERMA GmbH
- CCL Industries
- Weber Packaging Solutions
- ProMach Inc.
- Quadrel Labeling Systems
- Accraply Inc.
- Krones AG
- ALTech Srl
- Label-Aire Inc.
- CTM Labeling Systems
- Newman Labelling Systems
- Pack Leader Machinery
- Nita Labeling Equipment
- Domino Printing Sciences
- Marchesini Group
HERMA GmbH
- Estimated global market share: 11.8%
- Strong presence in high-speed pressure-sensitive labeling solutions.
- Extensive portfolio of automated systems exceeding 1,000 labels per minute.
- Significant investments in digital inspection technologies and Industry 4.0 integration.
- Strong customer base across pharmaceuticals, food, and industrial packaging sectors.
ProMach Inc.
- Estimated global market share: 9.4%
- Broad packaging automation portfolio with integrated labeling solutions.
- Strong distribution network across North America and Europe.
- Focus on modular equipment, smart diagnostics, and flexible manufacturing systems.
- Expanding presence in food processing, beverage bottling, and consumer goods packaging.