Pet Packaging Market Size
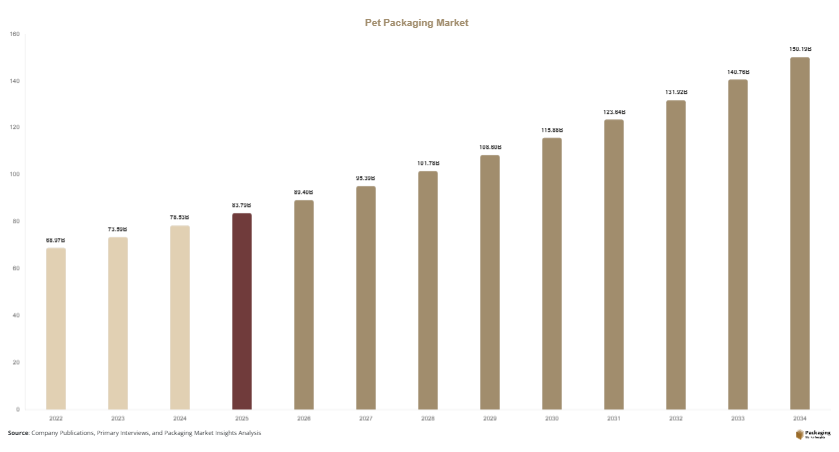
Pet packaging market size is projected at USD 89.40 billion in 2026 and is expected to hit USD 149.80 billion by 2034 with a CAGR of 6.7%. Rising demand for lightweight, recyclable, and transparent packaging across food, beverage, pharmaceutical, and personal care industries continues supporting market expansion. The report provides production analysis, market segmentation, competitive landscape, and regional assessment for comprehensive business intelligence.
The PET packaging market comprises packaging products manufactured using polyethylene terephthalate (PET), including bottles, containers, trays, jars, and films for consumer and industrial applications. Global production exceeded 38.6 million metric tons in 2026, while annual output surpassed 1.28 trillion PET packaging units. Food and beverage applications accounted for approximately 61% of total consumption, while bottles and jars represented nearly 58% of production. Recycled PET utilization exceeded 36% across newly manufactured packaging products, reinforcing long-term expansion of the PET packaging market.
Explore more data points, trends and opportunities Download Free Sample Report
Pet Packaging Market Trends
Rising Adoption of Recycled PET Packaging
Manufacturers continue expanding recycled PET (rPET) utilization to meet sustainability objectives and regulatory requirements. Global rPET production exceeded 13.9 million metric tons, while more than 48% of beverage manufacturers incorporated recycled PET into primary packaging. Lightweight bottle designs reduced resin consumption by approximately 16%, strengthening the PET packaging market.
Increasing Automation in PET Packaging Manufacturing
Advanced injection molding, blow molding, and thermoforming technologies continue improving production efficiency. Manufacturing facilities produced over 1.28 trillion PET packaging units during 2026, while automated quality inspection systems improved production accuracy by 21%. Smart manufacturing adoption exceeded 54% among large-scale packaging producers, supporting continued innovation in the pet packaging market.
Pet Packaging Market Drivers
Growing Demand for Sustainable Beverage and Food Packaging
Rapid growth in packaged food and bottled beverage consumption continues increasing PET packaging demand. Global bottled beverage production exceeded 890 billion units, while packaged food shipments increased by 11% during 2026. More than 72% of beverage manufacturers continue preferring PET due to its lightweight properties, durability, and recyclability, supporting the PET packaging market.
Pet Packaging Market Restraints
Volatility in Virgin PET Resin Prices
Fluctuating crude oil prices and resin supply constraints continue affecting production economics. Raw material expenses account for nearly 63% of manufacturing costs, while annual PET resin price fluctuations range between 10% and 18%. Supply disruptions continue creating procurement challenges across the pet packaging market.
Pet Packaging Market Opportunities
Expansion of Circular Economy and Recycling Infrastructure
Government investments and private-sector initiatives continue expanding PET recycling capacity worldwide. Global recycling facilities processed more than 31 million metric tons of PET materials during 2026, while investments exceeding USD 4.2 billion supported recycling infrastructure development. Rising demand for food-grade rPET creates strong opportunities for the PET packaging market.
Challenges in Pet Packaging Market
Meeting Sustainability Targets while Maintaining Packaging Performance
Manufacturers continue balancing recycled material content with packaging strength, clarity, and food safety compliance. More than 9% of annual revenue is allocated to research and development, while product validation exceeds 5,000 quality inspection cycles per production batch. Achieving regulatory compliance remains a significant challenge for the pet packaging market.
Report Scope
| Report Metric | Details |
|---|---|
| Market Size in 2025 | USD 83.79 Billion |
| Market Size in 2026 | USD 89.40 Billion |
| Market Size in 2034 | USD 149.80 Billion |
| CAGR | 6.7% (2026-2034) |
| Base Year for Estimation | 2025 |
| Historical Data | 2022-2024 |
| Forecast Period | 2026-2034 |
| Report Coverage | Revenue Forecast, Competitive Landscape, Supply Chain Disruption, Growth Factors, Environment & Regulatory Landscape and Trends |
| Geographies Covered | North America, Europe, APAC, Middle East and Africa, LATAM |
| Countries Covered | U.S., Canada, U.K., Germany, France, Spain, Italy, Russia, Nordic, Benelux, Rest of Europe, China, South Korea, Japan, India, Australia, Singapore, Taiwan, South East Asia, Rest of Asia-Pacific, UAE, Turky, Saudi Arabia, South Africa, Egypt, Nigeria, Rest of MEA, Brazil, Mexico, Argentina, Chile, Colombia, Rest of LATAM |
Explore more data points, trends and opportunities Download Free Sample Report
Pet Packaging Market Segmentation
The market is segmented by product type and end-use industry to evaluate manufacturing trends and application demand. Bottles and jars account for approximately 58% of total production, while food and beverage applications contribute nearly 61% of overall consumption. Annual manufacturing exceeds 1.28 trillion PET packaging units globally.
By Product Type
Bottles and jars dominate the market with approximately 58% share. Annual production exceeds 742 billion units, utilizing high-clarity PET materials with lightweight and impact-resistant properties. These products are extensively used for beverages, edible oils, household chemicals, and personal care products.
Trays and containers account for approximately 27% of production, exceeding 346 billion units annually. These packaging formats support fresh produce, meat, ready meals, and bakery products while offering excellent product visibility and stacking performance.
Films and sheets contribute nearly 15% of global production with annual output exceeding 192 billion units. These products provide superior thermoforming capability, barrier performance, and recyclability across food packaging and industrial applications.
By End-use Industry
Food and beverage represents the largest application with approximately 61% market share. Annual consumption exceeds 780 billion packaging units, supporting bottled water, carbonated drinks, dairy products, edible oils, and processed foods. Lightweight construction and recyclability continue driving adoption.
Personal care and cosmetics account for approximately 23% of market demand. Annual utilization exceeds 295 billion units, supporting shampoos, lotions, creams, and cosmetic packaging. High transparency and premium appearance enhance brand presentation.
Pharmaceutical applications contribute approximately 16% of total demand, exceeding 205 billion packaging units annually. PET packaging provides chemical resistance, dimensional stability, and compliance with stringent pharmaceutical packaging requirements.
Pet Packaging Market Segmentations
Product Type
- Bottles & Jars
- Trays & Containers
- Films & Sheets
End-use Industry
- Food & Beverage
- Personal Care & Cosmetics
- Pharmaceuticals
Pet Packaging Market Regional Outlook
North America
North America accounts for approximately 27% of global demand. Annual production exceeds 10.2 million metric tons, with the United States contributing nearly 81% of regional consumption. Beverage packaging remains the dominant application.
Europe
Europe represents approximately 28% of worldwide consumption. Germany, France, Italy, Spain, and the United Kingdom account for more than 72% of regional production. Annual manufacturing exceeds 10.8 million metric tons, supported by advanced recycling infrastructure.
Asia-Pacific
The Asia-Pacific dominates the market with approximately a 38% share. China, India, Japan, and Southeast Asian countries contribute nearly 80% of regional production. Manufacturing exceeds 14.7 million metric tons, driven by expanding food, beverage, and pharmaceutical industries.
Latin America
Latin America contributes approximately 4% of global demand. Brazil and Mexico account for nearly 69% of regional production, supported by packaged food and beverage manufacturing growth.
Middle East & Africa
The Middle East & Africa account for approximately 3% of worldwide consumption. GCC countries and South Africa continue investing in food processing, beverage manufacturing, and recycling infrastructure, supporting steady market expansion.
Top Players in the Pet Packaging Market
- Amcor plc
- Berry Global Inc.
- ALPLA Group
- Plastipak Holdings, Inc.
- Graham Packaging Company
- Gerresheimer AG
- Silgan Holdings Inc.
- RETAL Industries Ltd.
- Resilux NV
- Logoplaste Group
- Sonoco Products Company
- AptarGroup, Inc.
- Krones AG
- CCL Industries Inc.
- Alpha Packaging
Amcor plc
- Estimated market presence: 11–13%
- Global leader in rigid and flexible PET packaging solutions.
- Extensive manufacturing footprint across North America, Europe, Asia-Pacific, and Latin America.
- Strong portfolio serving food, beverage, pharmaceutical, and personal care industries.
- Continuous investment in recyclable packaging, lightweight bottle technology, and recycled PET integration strengthens manufacturing capabilities exceeding billions of packaging units annually. Strategic sustainability initiatives and circular economy partnerships reinforce the company's leadership position across global PET packaging markets.
ALPLA Group
- Estimated market presence: 9–11%
- Leading global manufacturer of PET bottles, preforms, closures, and recycling solutions.
- Strong production capabilities supported by advanced blow molding and injection molding technologies.
- Significant investments in food-grade recycled PET production and circular packaging systems.
- The company continues expanding manufacturing capacity while improving packaging efficiency through lightweight designs, automation, and sustainable material innovation, strengthening its competitive position across beverage and consumer goods industries.