Paper Cone Cup Market Size
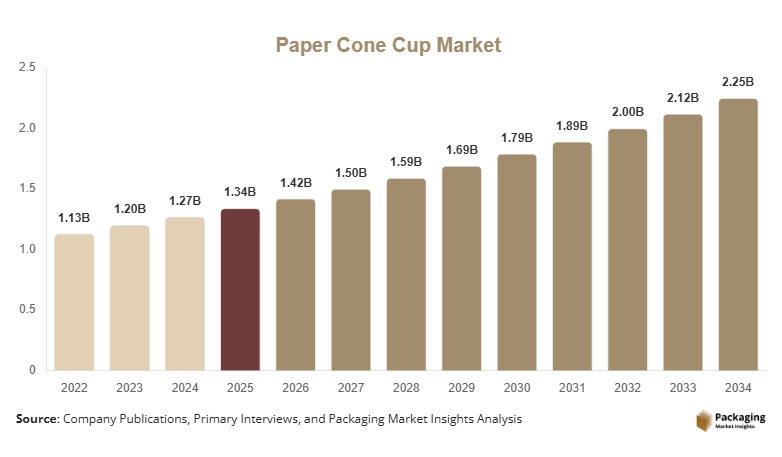
Paper cone cup market size is projected at USD 1.42 billion in 2026 and is expected to hit USD 2.24 billion by 2034 with a CAGR of 5.9%. The report evaluates market performance through comprehensive segmentation, production analysis, pricing trends, supply chain assessment, and competitive benchmarking. It also provides quantitative insights into manufacturing capacity, end-user demand, regional consumption, and technological developments shaping the industry landscape.
Paper cone cups are disposable paper-based drinking cups designed primarily for water dispensing, beverage consumption, and hygienic single-use applications across commercial, institutional, and healthcare environments. Global production exceeded 31.6 billion units in 2025, while market penetration across office buildings, educational institutions, and healthcare facilities surpassed 71%. Water-dispensing applications accounted for nearly 54% of total consumption, followed by food service at 29% and healthcare at 17%, reinforcing the expansion of the paper cone cup market.
Explore more data points, trends and opportunities Download Free Sample Report
Paper Cone Cup Trends
Growing Adoption of Sustainable and Recyclable Paper Packaging
Manufacturers are increasingly replacing plastic disposable cups with recyclable and biodegradable paper cone cups. More than 19.4 billion eco-friendly paper cone cups were produced during 2025, representing approximately 61% of global output. Recycled fiber utilization increased by 18%, while water-based coating technologies recorded adoption exceeding 42% among leading manufacturers. These developments continue strengthening the paper cone cup market.
Automation, digital printing, and lightweight paper technologies are improving manufacturing efficiency and product quality. High-speed converting lines now produce over 450 cups per minute, while automated inspection systems have reduced manufacturing defects by nearly 23%. Institutional demand from hospitals, schools, and corporate offices expanded by 9%, supporting continued innovation across the Paper Cone Cup market.
Paper Cone Cup Market Drivers
Increasing Demand for Hygienic Single-Use Drinking Solutions
Growing awareness regarding hygiene and sanitation continues driving demand across commercial facilities worldwide. More than 14 million water dispensers are installed globally, consuming over 16 billion paper cone cups annually. Institutional procurement increased by 11%, while disposable cup usage in healthcare facilities expanded by 15% during 2025. These factors continue accelerating the paper cone cup market.
Paper Cone Cup Market Restraints
Fluctuating Raw Material and Pulp Prices
Paper pulp prices experienced fluctuations of approximately 13% during 2025, increasing manufacturing costs by nearly 8%. Transportation expenses rose by 6%, while specialty coating materials recorded price increases exceeding 10%. These cost pressures reduce operating margins for manufacturers and restrain the paper cone cup market growth.
Paper Cone Cup Market Opportunities
Expansion of Sustainable Foodservice and Institutional Packaging
Demand for biodegradable disposable products continues expanding as sustainability regulations strengthen worldwide. Eco-certified paper packaging adoption increased by 22%, while public procurement of recyclable disposable products rose by 18%. Emerging economies accounted for nearly 41% of newly installed production capacity, creating significant opportunities across the paper cone cup market.
Challenges in Paper Cone Cup Market
Compliance with Environmental Standards and Waste Management
More than 75 countries have introduced regulations promoting sustainable packaging and reducing single-use plastics. Manufacturers allocate approximately 5–7% of annual revenue toward product certification, recycled material sourcing, and regulatory compliance. Waste collection and recycling infrastructure remain underdeveloped in several emerging economies, creating operational challenges within the paper cone cup market.
Report Scope
| Report Metric | Details |
|---|---|
| Market Size in 2025 | USD 1.34 Billion |
| Market Size in 2026 | USD 1.42 Billion |
| Market Size in 2034 | USD 2.24 Billion |
| CAGR | 5.9% (2026-2034) |
| Base Year for Estimation | 2025 |
| Historical Data | 2022-2024 |
| Forecast Period | 2026-2034 |
| Report Coverage | Revenue Forecast, Competitive Landscape, Supply Chain Disruption, Growth Factors, Environment & Regulatory Landscape and Trends |
| Geographies Covered | North America, Europe, APAC, Middle East and Africa, LATAM |
| Countries Covered | U.S., Canada, U.K., Germany, France, Spain, Italy, Russia, Nordic, Benelux, Rest of Europe, China, South Korea, Japan, India, Australia, Singapore, Taiwan, South East Asia, Rest of Asia-Pacific, UAE, Turkey, Saudi Arabia, South Africa, Egypt, Nigeria, Rest of MEA, Brazil, Mexico, Argentina, Chile, Colombia, Rest of LATAM |
Explore more data points, trends and opportunities Download Free Sample Report
Paper Cone Cup Market Segmentation
The market is segmented by type and application, with single wallpaper cone cups accounting for approximately 58% of total revenue, while water-dispensing applications contribute nearly 54% of overall consumption due to extensive deployment in offices, schools, factories, and healthcare institutions.
By Type
Single Wall Paper Cone Cups: This segment holds approximately 58% of the market, with annual production exceeding 18.3 billion units. These cups feature lightweight paperboard construction, cost-efficient manufacturing, easy dispensing, recyclable material composition, and compatibility with standard cone cup dispensers, making them the preferred choice across commercial facilities.
Double Wall Paper Cone Cups: Representing nearly 24% of total production, this segment manufactured approximately 7.6 billion units during 2025. Double-wall construction provides improved insulation, greater rigidity, enhanced durability, and better user comfort for warm and cold beverage applications.
Wax-Coated Paper Cone Cups: Accounting for around 18% of industry output, production surpassed 5.7 billion units annually. Wax-coated variants offer improved moisture resistance, leak prevention, extended liquid retention, and enhanced structural integrity for demanding environments.
By Application
Water Dispensing: Holding approximately 54% market share, this application consumes more than 17.1 billion units annually. Paper cone cups are widely used in offices, factories, schools, transportation hubs, and public institutions, providing hygienic, disposable, and cost-effective drinking solutions with high replacement frequency.
Food Service: Accounting for nearly 29% of market demand, food service applications utilized approximately 9.2 billion units during 2025. Restaurants, cafeterias, quick-service outlets, and catering businesses use paper cone cups for beverage sampling, water service, and promotional events while benefiting from low-cost disposable packaging.
Healthcare: Representing approximately 17% of total demand, healthcare facilities consumed over 5.3 billion units annually. Hospitals, diagnostic laboratories, clinics, and elderly care facilities rely on hygienic disposable paper cone cups for infection control, patient hydration, and regulated waste management practices.
Paper Cone Cup Market Segmentations
Type
- Single Wall Paper Cone Cups
- Double Wall Paper Cone Cups
- Wax-Coated Paper Cone Cups
Application
- Water Dispensing
- Food Service
- Healthcare
Paper Cone Cup Regional Outlook
North America
North America accounted for approximately 28% of global demand, producing more than 8.8 billion units annually. The United States represented nearly 83% of regional consumption, supported by healthcare institutions, corporate offices, educational campuses, and commercial water dispensing systems.
Europe
Europe contributed around 26% of the global market with production exceeding 8.2 billion units. Germany, France, the United Kingdom, Italy, and Spain collectively accounted for more than 72% of regional demand, driven by sustainability regulations and increasing recyclable packaging adoption.
Asia-Pacific
Asia-Pacific dominated the industry with approximately 38% market share and production surpassing 12.0 billion units annually. China contributed around 46% of regional manufacturing, followed by India, Japan, and South Korea, supported by rapid urbanization, institutional expansion, and growing foodservice activities.
Latin America
Latin America represented nearly 5% of the market, with Brazil and Mexico accounting for approximately 65% of regional demand. Expansion of hospitality, healthcare infrastructure, and commercial office spaces continues supporting paper cone cup consumption.
Middle East & Africa
The Middle East & Africa accounted for approximately 3% of global demand. Saudi Arabia, the UAE, and South Africa contributed over 59% of regional consumption, supported by investments in healthcare facilities, educational institutions, and hospitality sectors.
Top Players In The Paper Cone Cup Market
- Dart Container Corporation
- Huhtamaki Oyj
- Graphic Packaging International LLC,
- Genpak LLC,
- Pactiv Evergreen Inc.
- Bender's Paper Cups
- Go-Pak UK Ltd.
- Konie Cups International Inc.
- Detmold Group
- Kap Cones Pvt. Ltd.
- Scyphus
- F Bender Limited
- International Paper Company
- Georgia-Pacific LLC
- WestRock Company
Huhtamaki Oyj Estimated market share: 15–17% Maintains a strong global position through extensive production facilities, sustainable fiber-based packaging solutions, advanced paper converting technologies, and continuous investment in recyclable products. The company serves foodservice, institutional, and healthcare customers across multiple continents while emphasizing lightweight packaging, renewable materials, operational efficiency, and product innovation. Its broad distribution network and manufacturing capabilities support consistent leadership within the paper cone cup industry. Dart Container Corporation Estimated market share: 11–13% Recognized as a major disposable packaging manufacturer with significant production capacity across North America and international markets. The company focuses on cost-efficient manufacturing, quality assurance, automated production systems, and sustainable product development. Strong customer relationships, diversified packaging offerings, continuous facility expansion, and investments in recyclable paper products reinforce its competitive position within the global paper cone cup industry.