Straws Market Size
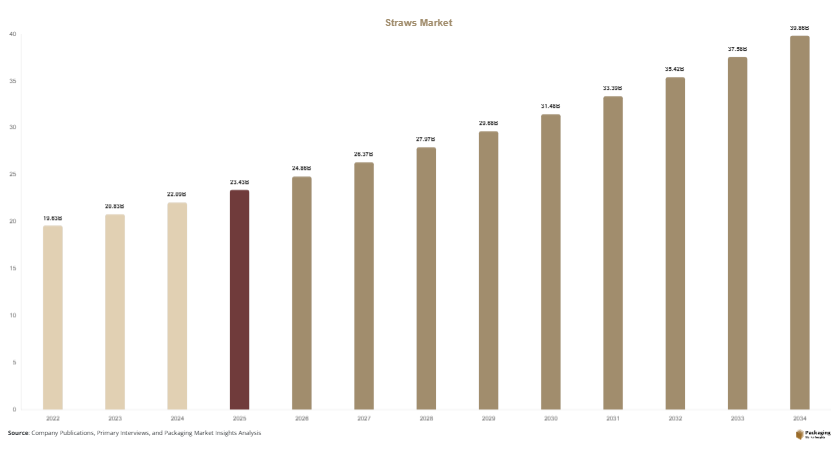
Straws market size is projected at USD 24.86 billion in 2026 and is expected to hit USD 39.82 billion by 2034 with a CAGR of 6.08%. The industry is witnessing rising investments in sustainable manufacturing, automation, and recyclable material processing across developed and emerging economies. Comprehensive market evaluation requires production statistics, demand mapping, segmentation analysis, pricing trends, supply chain assessment, and competitive landscape evaluation across major manufacturers and regional markets.
The straws market comprises disposable and reusable drinking straws manufactured using plastic, paper, metal, bamboo, silicone, and other materials for commercial and residential consumption. Global production exceeded 1.92 trillion units in 2025, while annual consumption surpassed 1.86 trillion units, with the food service segment contributing nearly 48% of total demand and beverage manufacturers accounting for approximately 31%. Reusable variants represented 14% market penetration, whereas paper-based alternatives exceeded 27% of newly installed production capacity, reinforcing the expanding straws market.
Explore more data points, trends and opportunities Download Free Sample Report
Straws Market Trends
Rising Adoption of Sustainable Straw Materials
Manufacturers are increasingly investing in recyclable and biodegradable materials as regulatory policies continue to restrict conventional single-use plastics. More than 620 billion paper straws were manufactured during 2025, representing an annual production increase of 15.4%, while biodegradable resin utilization expanded by 18%. Automated forming equipment now accounts for over 63% of new manufacturing installations, improving efficiency and reducing production waste across the global straws market.
Growing investments in premium reusable products are also reshaping manufacturing priorities. Stainless steel and silicone straw production exceeded 3.8 billion units in 2025, while reusable product adoption increased by 21% among hospitality operators. Digital quality inspection systems have been implemented in nearly 58% of large manufacturing facilities, supporting consistent product specifications and reinforcing the long-term straws market.
Straws Market Drivers
Expansion of Food Service and Beverage Consumption
The rapid expansion of quick-service restaurants, cafés, hotels, airlines, and food delivery platforms continues to stimulate product consumption. More than 820 billion beverage servings requiring drinking straws were recorded globally during 2025, while restaurant chains accounted for approximately 46% of total commercial demand. Manufacturing capacity utilization exceeded 81%, and export shipments increased by 9.7%, strengthening overall straws market growth.
Straws Market Restraints
Regulatory Restrictions on Conventional Plastic Products
Several governments continue implementing regulations restricting single-use plastic products, influencing manufacturing investments and product portfolios. Plastic straw production declined by approximately 7% in regulated regions, while compliance costs increased by nearly 11% for manufacturers transitioning toward sustainable materials. Production line modifications often require investments exceeding USD 3 million per facility, creating operational pressure across the straws market.
Straws Market Opportunities
Innovation in Eco-Friendly and Reusable Products
Increasing consumer preference for environmentally responsible products presents significant expansion opportunities. Biodegradable straw production capacity increased by 19%, while investment in paper converting equipment surpassed USD 820 million globally during 2025. Reusable straw demand expanded by 24%, supported by hospitality sustainability programs and institutional procurement initiatives, creating favorable opportunities across the straws market.
Challenges in Straws Market
Raw Material Cost Volatility and Product Performance
Manufacturers continue facing fluctuations in paper pulp, stainless steel, biodegradable polymers, and transportation costs. Paper raw material prices increased by approximately 9%, while logistics expenses rose by 6% during 2025. Product durability requirements, moisture resistance standards, and quality consistency remain major manufacturing challenges influencing profitability throughout the straws' market.
Report Scope
| Report Metric | Details |
|---|---|
| Market Size in 2025 | USD 23.43 Billion |
| Market Size in 2026 | USD 24.86 Billion |
| Market Size in 2034 | USD 39.82 Billion |
| CAGR | 6.08% (2026-2034) |
| Base Year for Estimation | 2025 |
| Historical Data | 2022-2024 |
| Forecast Period | 2026-2034 |
| Report Coverage | Revenue Forecast, Competitive Landscape, Supply Chain Disruption, Growth Factors, Environment & Regulatory Landscape and Trends |
| Geographies Covered | North America, Europe, APAC, Middle East and Africa, LATAM |
| Countries Covered | U.S., Canada, U.K., Germany, France, Spain, Italy, Russia, Nordic, Benelux, Rest of Europe, China, South Korea, Japan, India, Australia, Singapore, Taiwan, South East Asia, Rest of Asia-Pacific, UAE, Turky, Saudi Arabia, South Africa, Egypt, Nigeria, Rest of MEA, Brazil, Mexico, Argentina, Chile, Colombia, Rest of LATAM |
Explore more data points, trends and opportunities Download Free Sample Report
Straws Market Segmentation
The market is segmented according to product type and application, with plastic products accounting for approximately 49% of total production volume, followed by paper at 32% and reusable alternatives at 19%. Food service applications contributed nearly 48% of industry demand, while beverage manufacturers represented 31%, indicating diversified consumption across commercial sectors.
By Type
Plastic straws remain the largest production category despite regulatory restrictions. Production exceeded 940 billion units during 2025, accounting for nearly 49% of global output. High flexibility, lightweight construction, food-grade polypropylene composition, and cost-efficient manufacturing continue supporting commercial demand across convenience stores, restaurants, and beverage chains.
Paper straws represented approximately 32% of industry production with more than 620 billion units manufactured annually. Multi-layer kraft paper construction, food-safe adhesives, moisture-resistant coatings, and automated spiral winding technologies improve durability. Production capacity continues expanding as sustainability initiatives accelerate worldwide.
Metal straws contributed nearly 7% of total revenue while reusable consumption expanded steadily. Stainless steel products generally feature 18/8 food-grade specifications, corrosion resistance, an extended lifecycle exceeding 5 years, and dishwasher compatibility. Premium hospitality operators increasingly integrate reusable alternatives into sustainability programs.
By Application
Food service remains the leading application, with approximately 48% share. Restaurants, cafés, hotels, and fast-food chains consumed over 890 billion units during 2025. High-volume beverage dispensing, takeaway services, and branded promotional packaging continue driving procurement across commercial food establishments.
The beverage industry accounted for nearly 31% of consumption, utilizing approximately 580 billion units annually. Soft drinks, juices, milk beverages, smoothies, and ready-to-drink products maintain consistent purchasing patterns. Automated packaging compatibility and standardized dimensions remain critical technical requirements.
Household applications represented approximately 21% of market demand with annual consumption exceeding 390 billion units. Growing preference for reusable products, home entertaining, and eco-conscious purchasing behavior supports increasing penetration across residential consumers.
Straws Market Segmentations
Type
- Plastic Straws
- Paper Straws
- Metal Straws
- Other Reusable Straws
Application
- Food Service
- Beverage Industry
- Household
- Institutional Use
Distribution Channel
- Online Retail
- Supermarkets & Hypermarkets
- Specialty Stores
- Wholesale Distribution
- Direct Sales
Straws Market Regional Outlook
North America
North America accounted for approximately 28% of global revenue, producing more than 420 billion units annually. The United States represented nearly 79% of regional production, while Canada contributed around 14%. Strong food service demand and sustainable product adoption continue supporting regional expansion.
Europe
Europe represented nearly 25% of the global market with annual production exceeding 360 billion units. Germany, France, Italy, and the United Kingdom collectively generated over 68% of regional output. Paper and reusable products continue gaining market acceptance due to sustainability regulations.
Asia-Pacific
Asia-Pacific held the largest regional share at approximately 36%, producing more than 720 billion units annually. China accounted for nearly 49% of regional production, followed by India, Japan, and Southeast Asian countries. Expanding beverage manufacturing and food service industries continue driving production.
Latin America
Latin America contributed around 6% of global revenue, producing over 115 billion units annually. Brazil and Mexico together represented nearly 71% of regional demand, supported by expanding hospitality and retail sectors.
Middle East & Africa
The Middle East & Africa accounted for approximately 5% of the market with production exceeding 90 billion units annually. GCC countries maintained significant commercial demand, while South Africa remained a major manufacturing hub within the region.
Top players in the straws market
- Hoffmaster Group Inc.
- Aardvark Straws
- Transcend Packaging Ltd.
- Huhtamaki Oyj
- Vegware Ltd.
- Tetra Pak
- Footprint LLC
- Biopac UK Ltd.
- Soton Daily Necessities Co., Ltd.
- Fuling Global Inc.
- Canada Brown Eco Products
- Austraw Pty Ltd.
- Okstraw
- Eco-Products Inc.
- Lollicup USA Inc.
Hoffmaster Group Inc.
- Estimated market presence of approximately 8–10% within organized straw manufacturing.
- Strong manufacturing footprint with diversified paper and sustainable product portfolio.
- Focuses on automated production, food service partnerships, regulatory compliance, and continuous product innovation. The company maintains broad distribution across hospitality, institutional catering, and retail channels while investing in recyclable materials, production efficiency improvements, and sustainable manufacturing technologies to strengthen competitive positioning.
Huhtamaki Oyj
- Estimated organized market presence of approximately 6–8%.
- Leading supplier of sustainable foodservice packaging solutions globally.
- The company emphasizes renewable materials, paper conversion technology, and global manufacturing capabilities. Extensive research investments, regional production facilities, strategic customer partnerships, and environmentally responsible product development support long-term competitiveness while expanding sustainable straw offerings across food service and beverage applications.