Drink Cans Market Size
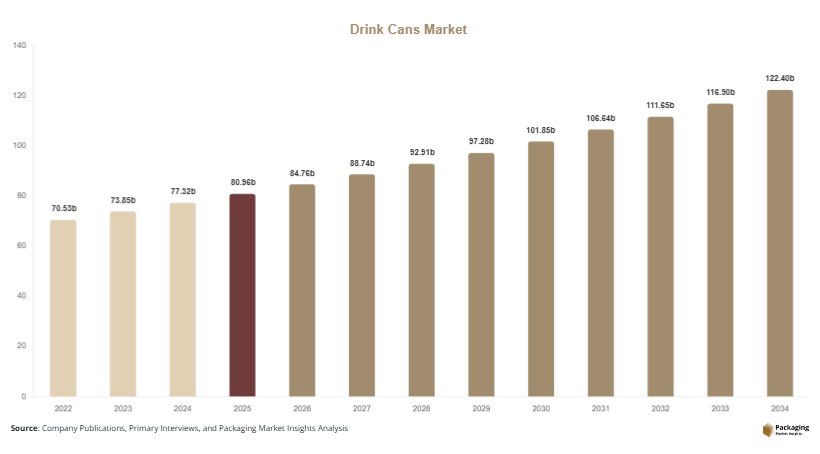
Drink Cans market size is projected at USD 84.76 billion in 2026 and is expected to hit USD 122.54 billion by 2034 with a CAGR of 4.7%. Increasing beverage consumption, higher demand for recyclable metal packaging, and continuous investments in can manufacturing facilities are supporting long-term industry expansion. The report provides comprehensive analysis of production capacity, consumption trends, competitive landscape, technological developments, and detailed segmentation across material types and applications to support strategic business decisions.
The Drink Cans market represents the global production, distribution, and consumption of metal beverage containers used for carbonated drinks, alcoholic beverages, juices, energy drinks, and ready-to-drink products. Global production exceeded 470 billion units during 2025, while aluminum cans accounted for nearly 78% of total output and steel cans represented approximately 22%. Beverage manufacturers continue expanding adoption because of recycling rates above 70% in several developed economies, lightweight construction, and extended product shelf life. Carbonated beverages contributed nearly 45% of total consumption, while alcoholic beverages accounted for approximately 31%, reinforcing steady Drink Cans market expansion.
Explore more data points, trends and opportunities Download Free Sample Report
Drink Cans Market Trends
Rising Adoption of Sustainable Metal Packaging
Growing emphasis on circular economy initiatives has accelerated investments in recyclable packaging technologies. More than 360 billion aluminum drink cans were produced globally during 2025, while recycled metal content exceeded 68% across major manufacturers. Lightweight can designs have reduced material consumption by nearly 12% over the past decade, improving transportation efficiency and lowering carbon emissions. Beverage companies continue replacing plastic packaging with metal alternatives, strengthening Drink Cans market trends.
Manufacturers are introducing digital printing, smart coating technologies, and lightweight alloys to improve production efficiency and branding flexibility. Automated production facilities now achieve speeds exceeding 2,400 cans per minute, while digital inspection systems have reduced manufacturing defects by nearly 18%. Demand from energy drinks and ready-to-drink coffee categories continues expanding at annual rates above 7%, reinforcing positive Drink Cans market trends.
Drink Cans Drivers
Growing Beverage Consumption and High Recycling Efficiency
Global beverage consumption continues increasing alongside urbanization and convenience-driven purchasing behavior. More than 510 billion beverage servings are packaged annually in metal cans, while premium beverage launches increased by approximately 9% during 2025. Aluminum recycling saves nearly 95% of the energy required for primary metal production, encouraging governments and manufacturers to expand recycling infrastructure. Rising investments exceeding USD 5 billion in new production facilities further support Drink Cans market growth.
Drink Cans Restraints
Volatility in Metal Raw Material Prices
Fluctuations in aluminum and steel prices continue affecting manufacturing profitability and procurement planning. Raw materials account for nearly 60% of total production costs, while aluminum prices experienced fluctuations exceeding 15% in recent years. Energy-intensive smelting operations and transportation expenses also influence production economics, creating pricing pressure across beverage packaging value chains and limiting Drink Cans market growth.
Drink Cans Opportunities
Expansion of Premium and Functional Beverage Categories
Demand for energy drinks, flavored sparkling water, kombucha, and ready-to-drink beverages continues creating substantial opportunities for metal can manufacturers. Premium beverage launches increased by over 11%, while functional beverage consumption expanded by approximately 8% annually. Investments in slim-can production lines and specialty printing technologies continue improving product differentiation and increasing Drink Cans market insights.
Challenges in Drink Cans
Capacity Expansion and Supply Chain Optimization
Meeting growing global beverage demand requires continuous investments in manufacturing capacity and logistics infrastructure. New production facilities require investments exceeding USD 300 million per plant, while transportation costs account for nearly 14% of finished product expenses. Maintaining consistent raw material supply, improving recycling rates, and reducing production downtime remain major operational priorities across the Drink Cans market.
Report Scope
| Report Metric | Details |
|---|---|
| Market Size in 2025 | USD 80.96 billion |
| Market Size in 2026 | USD 84.76 billion |
| Market Size in 2034 | USD 122.54 billion |
| CAGR | 4.7% (2026-2034) |
| Base Year for Estimation | 2025 |
| Historical Data | 2022-2024 |
| Forecast Period | 2026-2034 |
| Report Coverage | Revenue Forecast, Competitive Landscape, Supply Chain Disruption, Growth Factors, Environment & Regulatory Landscape and Trends |
| Geographies Covered | North America, Europe, APAC, Middle East and Africa, LATAM |
| Countries Covered | U.S., Canada, U.K., Germany, France, Spain, Italy, Russia, Nordic, Benelux, Rest of Europe, China, South Korea, Japan, India, Australia, Singapore, Taiwan, South East Asia, Rest of Asia-Pacific, UAE, Turky, Saudi Arabia, South Africa, Egypt, Nigeria, Rest of MEA, Brazil, Mexico, Argentina, Chile, Colombia, Rest of LATAM |
Explore more data points, trends and opportunities Download Free Sample Report
Drink Cans Market Segmentation
Aluminum remained the dominant material with approximately 78% market share during 2025, while carbonated soft drinks represented nearly 45% of global consumption. Rising beverage production and increasing preference for sustainable packaging continue supporting balanced segment expansion.
By Type
Aluminum
Aluminum dominates global production because of lightweight properties, corrosion resistance, and excellent recyclability. The segment accounted for nearly 366 billion units during 2025 with wall thickness below 0.10 mm, supporting efficient transportation and high-speed filling operations.
Steel
Steel drink cans maintain strong demand in selected beverage categories because of durability, cost competitiveness, and structural strength. Production exceeded 100 billion units, with protective internal coatings improving product compatibility and shelf stability.
Others
Specialty metal containers, hybrid materials, and niche packaging formats represent a smaller portion of industry output. These products primarily serve premium beverages, customized packaging solutions, and limited-edition product launches while supporting innovation across the industry.
By Application
Carbonated Soft Drinks
This segment maintained approximately 45% market share with production exceeding 210 billion units annually. High filling speeds, pressure resistance, and excellent barrier properties make drink cans the preferred packaging format for carbonated beverages.
Alcoholic Beverages
Beer, hard seltzers, cocktails, and flavored alcoholic drinks accounted for nearly 31% of demand. Production exceeded 145 billion cans, supported by growing preference for portable, lightweight, and recyclable beverage packaging.
Energy & Functional Drinks
This segment represented nearly 18% of global consumption and continues recording strong expansion. Slim-can formats, premium printing, and enhanced branding capabilities support increasing market penetration above 60% among newly launched functional beverage products.
Drink Cans Market Segmentations
Material
- Aluminum
- Steel
- Others
Application
- Carbonated Soft Drinks
- Alcoholic Beverages
- Energy & Functional Drinks
Drink Cans Regional Outlook
North America
North America accounted for approximately 29% of global revenue. The United States contributed nearly 84% of regional production, while annual output exceeded 95 billion units. Strong recycling infrastructure and premium beverage consumption continue driving market expansion.
Europe
Europe represented nearly 27% of global demand, supported by stringent sustainability regulations and high aluminum recycling rates exceeding 75%. Germany, the United Kingdom, France, and Spain remain leading production and consumption centers.
Asia-Pacific
Asia-Pacific held approximately 34% market share and recorded the fastest production growth. China, Japan, India, South Korea, and Southeast Asia collectively produced more than 190 billion units, supported by rising urbanization and expanding beverage manufacturing capacity.
Latin America
Latin America accounted for nearly 6% of global demand. Brazil and Mexico dominated regional production, supported by increasing canned beverage consumption and investments in modern can manufacturing facilities.
Middle East & Africa
The Middle East & Africa represented approximately 4% of the market. Expanding beverage industries, population growth, and improving retail infrastructure continue supporting gradual production and consumption growth across the region.
Top players in Drink Cans
- Ball Corporation
- Crown Holdings, Inc.
- Ardagh Metal Packaging
- CANPACK Group
- Toyo Seikan Group Holdings Ltd.
- CPMC Holdings Limited
- Baosteel Packaging Co., Ltd.
- Silgan Holdings Inc.
- Orora Limited
- Showa Aluminum Can Corporation
- Nampak Ltd.
- Trivium Packaging
Ball Corporation
-
Estimated global market share of approximately 24% within the beverage can manufacturing industry.
-
Operates extensive manufacturing facilities across North America, Europe, South America, and Asia with annual production capacity exceeding 100 billion cans. The company focuses on lightweight aluminum packaging, sustainability initiatives, advanced digital printing, and continuous investments in manufacturing automation. Strong partnerships with global beverage producers and ongoing expansion projects reinforce its leadership position across premium and high-volume beverage packaging markets.
Crown Holdings, Inc.
-
Estimated market share of approximately 19% in the global beverage can industry.
-
Maintains a diversified manufacturing network serving soft drinks, beer, energy drinks, and specialty beverages. The company emphasizes recyclable aluminum packaging, operational efficiency, and innovation through high-speed production technologies capable of manufacturing billions of beverage cans annually. Continuous investments in emerging markets and sustainable packaging solutions strengthen its competitive position across international beverage supply chains.