Industrial Chemical Packaging Market Size
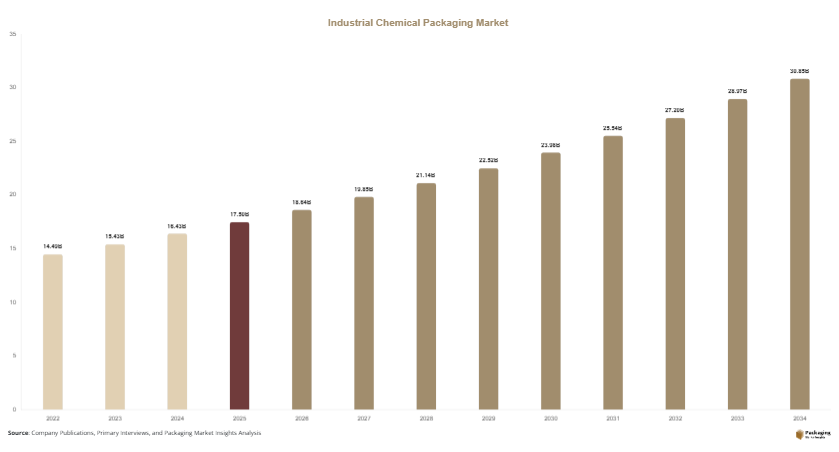
The industrial chemical packaging market size is projected at USD 18.64 billion in 2026 and is expected to hit USD 30.81 billion by 2034 with a CAGR of 6.5%.
The market is driven by increasing industrial chemical production, expanding global trade, and stringent regulations governing hazardous material transportation. The report provides comprehensive data across packaging type, material, regional performance, competitive landscape, production capacity, consumption trends, and investment activity. Detailed segmentation and competitive benchmarking support strategic decision-making across the industrial chemical packaging market.
Industrial chemical packaging refers to specialized packaging systems designed for storing, handling, transporting, and protecting hazardous and non-hazardous industrial chemicals. The market includes rigid and flexible packaging formats manufactured to comply with international safety standards for bulk and intermediate-scale logistics. Global industrial chemical production exceeded 2.9 billion metric tons annually, while hazardous chemicals represented approximately 24% of worldwide chemical shipments. Plastic packaging accounted for nearly 47% of industrial chemical packaging demand, metal formats represented 34%, and paper-based solutions contributed 19%. Adoption of certified UN-approved packaging continues to exceed 70% among exporters, reinforcing the industrial chemical packaging market.
Explore more data points, trends and opportunities Download Free Sample Report
Industrial Chemical Packaging Market Trends
Rising Adoption of Sustainable and High-Performance Packaging
Manufacturers are increasingly replacing conventional heavy containers with lightweight, recyclable, and reusable industrial packaging systems. More than 520 million industrial packaging units were produced globally in 2025, while recycled resin utilization increased beyond 31% across plastic chemical containers. Reusable intermediate bulk containers experienced adoption rates exceeding 42% among large chemical manufacturers, reducing logistics costs by nearly 18%. Sustainability investments continue to strengthen the industrial chemical packaging market.
Automation is transforming industrial chemical packaging through smart filling systems, RFID-enabled container tracking, and digital monitoring technologies. Over 58% of large chemical packaging facilities have integrated automated filling operations, improving production efficiency by approximately 23%. Smart packaging adoption exceeded 29% among multinational chemical suppliers, while industrial packaging output surpassed 610 million units annually across automated production lines. Digital transformation remains a significant trend supporting the industrial chemical packaging market.
Industrial Chemical Packaging Market Drivers
Growing Global Chemical Manufacturing and Cross-Border Trade
Rapid expansion in specialty chemicals, petrochemicals, agrochemicals, and industrial solvents is driving packaging demand worldwide. Global chemical exports exceeded USD 2.4 trillion, while industrial chemical production increased by approximately 5.8% year over year. Bulk liquid transportation volumes surpassed 1.3 billion metric tons, creating demand for durable drums, IBCs, and flexible bulk packaging. Nearly 67% of industrial chemical producers continue investing in advanced packaging systems to improve safety and logistics efficiency, strengthening the industrial chemical packaging market.
Industrial Chemical Packaging Market Restraints
Volatility in Raw Material Prices and Regulatory Compliance Costs
Fluctuating prices of polyethylene, polypropylene, and steel significantly affect packaging manufacturing costs. Plastic resin prices experienced variations of 12–18% during recent years, while steel prices fluctuated by approximately 15%. Compliance with hazardous goods regulations can increase production costs by 8–14%, particularly for UN-certified containers. These cost pressures influence profitability across manufacturers participating in the industrial chemical packaging market.
Industrial Chemical Packaging Market Opportunities
Expansion of Circular Economy and Reusable Packaging Systems
Increasing investments in reusable industrial packaging create substantial opportunities for manufacturers. Reconditioned drums and reusable IBC fleets have expanded by over 27%, while industrial recycling rates for packaging materials surpassed 46% globally. Demand for refillable chemical transport solutions is expected to increase by nearly 8% annually, supported by sustainability initiatives and corporate ESG commitments. These developments continue creating opportunities within the industrial chemical packaging market.
Challenges in Industrial Chemical Packaging Market
Maintaining Safety Standards Across Global Supply Chains
Manufacturers must comply with multiple international transportation and hazardous material regulations while ensuring packaging integrity. More than 190 countries follow varying chemical transportation standards, increasing certification complexity. Approximately 6% of industrial packaging products require redesign annually due to evolving compliance requirements, while quality inspection costs have increased by nearly 11%. Regulatory complexity remains a key challenge for the industrial chemical packaging market.
Report Scope
| Report Metric | Details |
|---|---|
| Market Size in 2025 | USD 17.50 Billion |
| Market Size in 2026 | USD 18.64 Billion |
| Market Size in 2034 | USD 30.81 Billion |
| CAGR | 6.5% (2026-2034) |
| Base Year for Estimation | 2025 |
| Historical Data | 2022-2024 |
| Forecast Period | 2026-2034 |
| Report Coverage | Revenue Forecast, Competitive Landscape, Supply Chain Disruption, Growth Factors, Environment & Regulatory Landscape and Trends |
| Geographies Covered | North America, Europe, APAC, Middle East and Africa, LATAM |
| Countries Covered | U.S., Canada, U.K., Germany, France, Spain, Italy, Russia, Nordic, Benelux, Rest of Europe, China, South Korea, Japan, India, Australia, Singapore, Taiwan, South East Asia, Rest of Asia-Pacific, UAE, Turkey, Saudi Arabia, South Africa, Egypt, Nigeria, Rest of MEA, Brazil, Mexico, Argentina, Chile, Colombia, Rest of LATAM |
Explore more data points, trends and opportunities Download Free Sample Report
Industrial Chemical Packaging Market Segmentation
Packaging demand is primarily segmented by packaging type and material. Packaging types account for over 61% of market differentiation, while material selection contributes nearly 39% based on chemical compatibility, transportation efficiency, durability, and sustainability requirements.
By Type
Drums remain the largest packaging type with approximately 44% market share. Steel drums, plastic drums, fiber drums, and composite drums are extensively used for solvents, lubricants, acids, and specialty chemicals. Annual production exceeded 260 million units, with capacities ranging from 20 liters to 250 liters. Their superior stacking strength and leak resistance maintain strong demand.
IBCs represent nearly 35% of market demand due to efficient bulk transportation. Rigid IBCs, composite IBCs, stainless steel IBCs, and foldable IBCs support capacities between 500 liters and 1,500 liters. Production exceeded 42 million units annually, while reuse rates surpassed 58% in developed industrial markets.
Flexible packaging contributes around 21% of total demand through FIBCs, bulk liners, flexible tanks, and woven industrial bags. Production exceeded 310 million flexible units, supporting dry chemicals, powders, and granular materials with lower logistics costs and reduced storage requirements.
By Application (Material)
Plastic packaging accounts for approximately 47% of total consumption. HDPE containers, PP drums, multilayer plastic packaging, and fluorinated containers provide high chemical resistance, lightweight construction, and excellent impact performance. Annual production exceeded 290 million units, with adoption surpassing 60% across liquid chemical transportation.
Metal packaging represents nearly 34% of market demand through steel drums, stainless steel containers, aluminum packaging, and metal pails. Production exceeded 180 million units annually, offering superior pressure resistance and extended lifecycles for hazardous chemicals.
Paper-based industrial packaging contributes roughly 19% of market consumption through fiber drums, industrial sacks, corrugated chemical cartons, and laminated paper containers. Production surpassed 9 million metric tons, supporting dry chemical handling with improved recyclability and lower environmental impact.
Industrial Chemical Packaging Market Segmentations
Packaging Type
- Drums
- Intermediate Bulk Containers (IBCs)
- Flexible Bulk Packaging
Material
- Plastic
- Metal
- Paper & Paperboard
Industrial Chemical Packaging Regional Outlook
North America
North America accounts for approximately 28% of the global market, supported by advanced chemical manufacturing and stringent hazardous material regulations. The United States contributes nearly 82% of regional production, while Canada and Mexico continue expanding industrial chemical exports. Annual packaging production exceeds 165 million units.
Europe
Europe represents nearly 26% market share, with Germany, France, Italy, and the United Kingdom leading production. Regional recycling rates exceed 54%, while reusable industrial packaging penetration approaches 48%. Industrial chemical exports continue supporting steady packaging demand.
Asia-Pacific
Asia-Pacific dominates with approximately 35% of global demand. China contributes nearly 46% of regional production, followed by India, Japan, and South Korea. Chemical packaging production exceeds 240 million units annually, supported by rapid industrialization and expanding petrochemical capacity.
Latin America
Latin America contributes around 6% of global demand. Brazil leads regional production with nearly a 43% share, followed by Mexico and Argentina. Industrial chemical exports and agricultural chemical consumption continue driving packaging investments.
Middle East & Africa
The Middle East & Africa account for approximately 5% of market demand. Saudi Arabia, the UAE, and South Africa dominate regional consumption through petrochemical production and industrial chemical exports. Packaging production continues expanding alongside refinery investments.
Top Players In The Industrial Chemical Packaging Market
- Greif Inc.
- Mauser Packaging Solutions
- SCHÜTZ GmbH & Co. KGaA
- Berry Global Inc.
- Time Technoplast Ltd.
- Hoover CS
- Schutz Container Systems
- Balmer Lawrie & Co. Ltd.
- Snyder Industries LLC
- Peninsula Drums Pty Ltd.
- CurTec Holdings B.V.
- THIELMANN AG
- Nefab Group
- CL Smith Company
- Sicagen India Limited
Greif Inc.
- Estimated global market share: 12–14%
- Strong presence in steel drums, fiber drums, and IBC manufacturing.
- Operates production facilities across North America, Europe, Asia-Pacific, and Latin America.
- Focuses on sustainable packaging with extensive reconditioning and recycling operations.
- Broad customer base across petrochemicals, industrial chemicals, lubricants, and specialty chemicals strengthens its competitive positioning.
Mauser Packaging Solutions
- Estimated global market share: 10–12%
- Global leader in reusable industrial packaging and closed-loop packaging services.
- Extensive portfolio includes plastic drums, steel drums, IBCs, and reconditioned packaging.
- Operates integrated collection and reconditioning networks supporting circular economy initiatives.
- Strong investments in sustainable manufacturing, logistics optimization, and high-performance chemical packaging reinforce long-term market leadership.