Pharmaceutical Track And Trace Systems Market Size
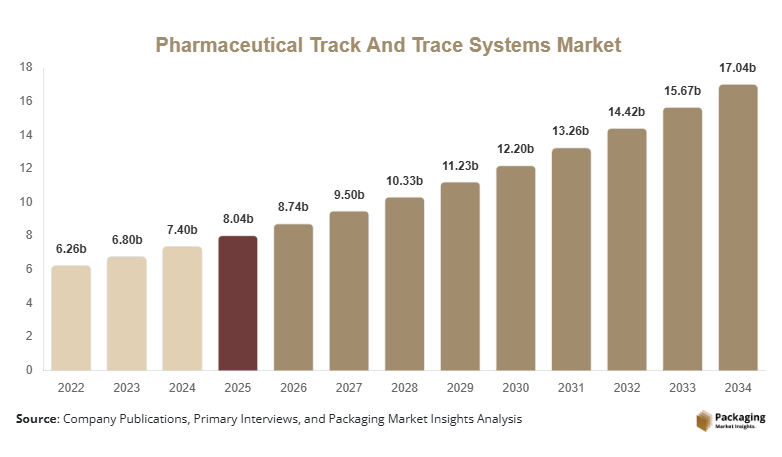
Pharmaceutical Track And Trace Systems market size is projected at USD 8.74 billion in 2026 and is expected to hit USD 17.08 billion by 2034 with a CAGR of 8.7%. Increasing regulatory compliance requirements, pharmaceutical serialization mandates, and digital supply chain transformation are accelerating market expansion. The report evaluates production deployment, market segmentation, technology adoption, and the competitive landscape across major regional markets.
Pharmaceutical track and trace systems comprise hardware, software, and integrated serialization platforms designed to authenticate pharmaceutical products and improve supply chain visibility. More than 685,000 serialization systems were operational worldwide during 2025, while pharmaceutical serialization compliance exceeded 82% among large manufacturers. Serialization solutions represented approximately 48% of total deployments, aggregation systems contributed 31%, and tracking software accounted for 21%. Pharmaceutical manufacturers generated nearly 58% of global implementation demand, reinforcing the Pharmaceutical Track And Trace Systems Market.
Explore more data points, trends and opportunities Download Free Sample Report
Pharmaceutical Track And Trace Systems Trends
Rising Adoption of Cloud-Based Serialization Platforms
Cloud-connected serialization and track-and-trace platforms are becoming standard across pharmaceutical manufacturing facilities. More than 142,000 new software licenses were deployed globally during 2025, representing annual adoption growth of 15.4%. AI-enabled verification solutions achieved implementation rates above 34%, while blockchain-supported product authentication projects increased by 19%, strengthening the Pharmaceutical Track And Trace Systems Market.
Manufacturers continue investing in integrated packaging line automation and real-time product visibility. Global investments exceeded USD 1.4 billion between 2023 and 2025, while aggregation technologies improved warehouse efficiency by nearly 18%. Automated data exchange platforms reduced supply chain errors by approximately 22%, supporting the Pharmaceutical Track And Trace Systems Market.
Pharmaceutical Track And Trace Systems Drivers
Stringent Global Pharmaceutical Serialization Regulations
Government regulations requiring unique product identification and supply chain transparency continue driving adoption. More than 92 countries have implemented or expanded pharmaceutical traceability regulations, while compliance among branded drug manufacturers exceeded 88%. Packaging line automation increased by 17%, and serialized product volumes surpassed 146 billion units annually, accelerating the Pharmaceutical Track And Trace Systems Market.
Pharmaceutical Track And Trace Systems Restraints
High Deployment and System Integration Costs
The implementation of enterprise-wide track-and-trace infrastructure requires significant investment in software, hardware, and packaging line upgrades. Initial deployment costs increased by approximately 13% during 2025, while system validation represented nearly 16% of project expenditure. Small pharmaceutical manufacturers continue facing financial constraints, limiting broader expansion of the Pharmaceutical Track And Trace Systems Market.
Pharmaceutical Track And Trace Systems Opportunities
Expansion of Digital Healthcare Supply Chains
Increasing adoption of digital healthcare infrastructure and pharmaceutical exports creates substantial opportunities. Cross-border pharmaceutical shipments increased by approximately 11% during 2025, while cloud-based compliance solutions achieved adoption rates exceeding 37%. Investments in AI-powered product authentication and predictive analytics continue creating long-term opportunities for the Pharmaceutical Track And Trace Systems Market.
Challenges in Pharmaceutical Track And Trace Systems Market
Managing Complex Global Compliance Standards
Manufacturers must comply with varying serialization regulations, reporting standards, and database integration requirements across multiple countries. More than 30 major regulatory frameworks currently exist worldwide, increasing implementation complexity by nearly 18%. Cybersecurity spending also increased by 14% to protect serialized pharmaceutical data, creating operational challenges across the Pharmaceutical Track And Trace Systems Market.
Report Scope
| Report Metric | Details |
|---|---|
| Market Size in 2025 | USD 8.04 billion |
| Market Size in 2026 | USD 8.74 billion |
| Market Size in 2034 | USD 17.08 billion |
| CAGR | 8.7% (2026-2034) |
| Base Year for Estimation | 2025 |
| Historical Data | 2022-2024 |
| Forecast Period | 2026-2034 |
| Report Coverage | Revenue Forecast, Competitive Landscape, Supply Chain Disruption, Growth Factors, Environment & Regulatory Landscape and Trends |
| Geographies Covered | North America, Europe, APAC, Middle East and Africa, LATAM |
| Countries Covered | U.S., Canada, U.K., Germany, France, Spain, Italy, Russia, Nordic, Benelux, Rest of Europe, China, South Korea, Japan, India, Australia, Singapore, Taiwan, South East Asia, Rest of Asia-Pacific, UAE, Turky, Saudi Arabia, South Africa, Egypt, Nigeria, Rest of MEA, Brazil, Mexico, Argentina, Chile, Colombia, Rest of LATAM |
Explore more data points, trends and opportunities Download Free Sample Report
Pharmaceutical Track And Trace Systems Market Segmentation
The market is segmented by type and application. Serialization solutions accounted for approximately 48% of global revenue during 2025, while pharmaceutical manufacturers represented nearly 58% of worldwide implementation due to mandatory regulatory compliance.
By Type
Serialization systems held approximately 48% of market revenue with deployments exceeding 328,000 systems globally. These solutions generate unique product identifiers, support GS1 standards, and enable real-time product authentication.
Aggregation platforms represented approximately 31% of global demand with more than 212,000 installed systems. Parent-child data relationships improve pallet, case, and carton traceability while increasing warehouse efficiency.
Tracking software accounted for nearly 21% of market revenue with over 145,000 enterprise installations. Cloud deployment, ERP integration, and AI-based analytics enhance end-to-end pharmaceutical visibility.
By Application
This segment generated approximately 58% of total market demand with more than 397,000 operational systems worldwide. Regulatory compliance, counterfeit prevention, and supply chain optimization remain primary adoption drivers.
CMOs represented approximately 24% of global demand. Multi-client production environments increasingly require serialization, aggregation, and centralized compliance management.
Pharmaceutical distributors accounted for nearly 18% of market demand. Warehouse automation, shipment verification, and inventory visibility continue driving technology deployment.
Pharmaceutical Track And Trace Systems Market Segmentations
Product Type
- Serialization Solutions
- Aggregation Solutions
- Tracking Software
Application
- Pharmaceutical Manufacturers
- Contract Manufacturing Organizations
- Pharmaceutical Distribution
Distribution Channel
- Direct Sales
- System Integrators
- Value-Added Resellers
- Technology Partners
- Cloud-Based Service Providers
Pharmaceutical Track And Trace Systems Regional Outlook
North America
North America accounted for approximately 38% of global revenue during 2025 with over 260,000 installed systems. The United States represented nearly 84% of regional demand due to DSCSA compliance, pharmaceutical manufacturing expansion, and digital healthcare investments.
Europe
Europe represented approximately 30% of worldwide demand with more than 205,000 operational systems. Germany, France, Italy, the United Kingdom, and Spain remained leading adopters due to FMD compliance and advanced pharmaceutical production.
Asia-Pacific
Asia-Pacific captured approximately 25% of global revenue. China, India, Japan, South Korea, and Singapore accounted for over 76% of regional demand, supported by pharmaceutical exports and government serialization initiatives.
Latin America, Middle East & Africa
These regions collectively represented approximately 7% of worldwide demand with over 48,000 installed systems. Brazil, Mexico, Saudi Arabia, South Africa, and the UAE continue expanding pharmaceutical supply chain digitalization.
Top players in Pharmaceutical Track And Trace Systems Market
- Antares Vision S.p.A.
- TraceLink Inc.
- OPTEL Group
- Systech International LLC
- Siemens AG
- Zebra Technologies Corporation
- Axway Software
- Körber AG
- SAP SE
- IBM Corporation
- SEA Vision S.r.l.
- WIPOTEC GmbH
Antares Vision S.p.A.
-
Estimated global market share of approximately 17%.
-
Strong portfolio of serialization, inspection, and aggregation technologies.
-
Extensive pharmaceutical customer base across Europe, North America, and Asia-Pacific.
-
Continuous investment in AI-powered inspection systems, cloud connectivity, and regulatory compliance solutions strengthens its competitive leadership.
TraceLink Inc.
-
Estimated market share of approximately 14% globally.
-
Leading provider of cloud-based pharmaceutical supply chain and serialization platforms.
-
Extensive network connecting manufacturers, distributors, wholesalers, and healthcare providers.
-
Ongoing investments in digital compliance, blockchain integration, and intelligent supply chain visibility enhance long-term market positioning.