Container Glass Market Size
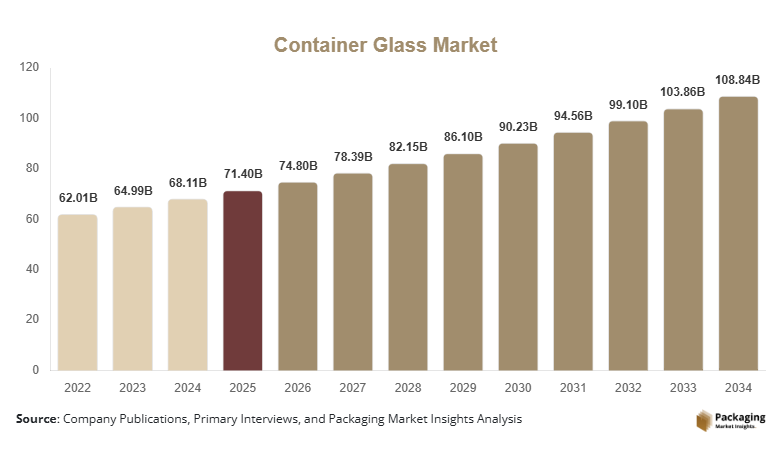
Container glass market size is projected at USD 74.8 billion in 2026 and is expected to hit USD 108.6 billion by 2034 with a CAGR of 4.8%. Rising consumption of sustainable packaging, expanding food and beverage manufacturing, and increasing pharmaceutical packaging requirements continue to support industry expansion. The report provides extensive data on market segmentation, production capacity, supply chain performance, technological developments, and the competitive landscape across major economies.
Container glass consists of molded glass packaging products designed for beverages, food products, pharmaceuticals, cosmetics, and household goods. Global production exceeded 865 billion glass containers in 2025, while annual output is projected to surpass 890 billion units in 2026. Food and beverage applications contribute nearly 69% of total demand, pharmaceuticals account for approximately 18%, and personal care products represent 13%. Recycled glass (cullet) utilization has reached nearly 41% of production in advanced manufacturing facilities, strengthening the container glass market.
Explore more data points, trends and opportunities Download Free Sample Report
Container Glass Market Trends
Increasing Adoption of Lightweight and Sustainable Glass Packaging
Manufacturers are introducing lightweight container glass solutions to reduce transportation costs and carbon emissions without compromising product strength. More than 265 billion lightweight glass containers are expected to be produced in 2026, representing nearly 30% of total global output. Automated inspection systems now operate in over 58% of large production facilities, while recycled glass usage continues to increase by nearly 7% annually. These developments continue to strengthen the container glass market.
Glass manufacturers are investing in electric melting furnaces, AI-enabled quality inspection systems, and advanced forming technologies. Annual production capacity additions exceed 22 billion containers, while digital monitoring technologies have improved manufacturing efficiency by nearly 18%. Demand from premium beverages, pharmaceuticals, and luxury cosmetics continues to accelerate innovation, reinforcing the container glass market.
Container Glass Drivers
Growing Demand for Sustainable and Recyclable Packaging
Glass packaging offers high recyclability and product safety, making it a preferred packaging material across multiple industries. More than 72% of premium beverage manufacturers have increased glass packaging adoption, while global recycled glass collection exceeds 165 million tons annually. Food and beverage production continues expanding above 5% annually, supporting container glass market growth.
Container Glass Restraints
High Energy Consumption and Manufacturing Costs
Container glass manufacturing requires furnace temperatures exceeding 1,500°C, resulting in high energy consumption and production costs. Energy expenses account for nearly 28% of manufacturing costs, while raw material prices fluctuate by 8%–14% annually. Smaller manufacturers face increasing operational pressure, limiting expansion within the container glass market.
Container Glass Opportunities
Expansion of Pharmaceutical and Premium Beverage Packaging
The pharmaceutical sector continues increasing demand for sterile glass vials and bottles, while premium alcoholic beverages favor glass packaging for quality preservation. Pharmaceutical glass container production exceeds 95 billion units annually, and premium beverage packaging demand is growing by nearly 6.5% each year. These trends create attractive opportunities across the container glass market.
Challenges in Container Glass Market
Supply Chain Volatility and Carbon Emission Regulations
Manufacturers continue facing volatility in soda ash, silica sand, and natural gas supplies. Raw material costs have increased between 9% and 15%, while environmental regulations require emissions reductions exceeding 30% over the next decade in several regions. Compliance investments continue increasing production costs, creating challenges for the container glass market.
Report Scope
| Report Metric | Details |
|---|---|
| Market Size in 2025 | USD 71.4 Billion |
| Market Size in 2026 | USD 74.8 Billion |
| Market Size in 2034 | USD 108.6 Billion |
| CAGR | 4.8% (2026-2034) |
| Base Year for Estimation | 2025 |
| Historical Data | 2022-2024 |
| Forecast Period | 2026-2034 |
| Report Coverage | Revenue Forecast, Competitive Landscape, Supply Chain Disruption, Growth Factors, Environment & Regulatory Landscape and Trends |
| Geographies Covered | North America, Europe, APAC, Middle East and Africa, LATAM |
| Countries Covered | U.S., Canada, U.K., Germany, France, Spain, Italy, Russia, Nordic, Benelux, Rest of Europe, China, South Korea, Japan, India, Australia, Singapore, Taiwan, South East Asia, Rest of Asia-Pacific, UAE, Turkey, Saudi Arabia, South Africa, Egypt, Nigeria, Rest of MEA, Brazil, Mexico, Argentina, Chile, Colombia, Rest of LATAM |
Explore more data points, trends and opportunities Download Free Sample Report
Container Glass Market Segmentation
The market is segmented by product type and end-use industry. Bottles account for approximately 63% of global consumption, followed by jars at 24% and vials at 13%. Food and beverage applications remain dominant with nearly 69% of overall market demand.
By Product Type
Bottles
Glass bottles account for nearly 63% of total production, exceeding 560 billion units annually. They are manufactured in capacities ranging from 50 ml to 5 liters and are widely used for alcoholic beverages, soft drinks, edible oils, and dairy products. High recycling rates and excellent barrier properties continue driving demand.
Jars
Glass jars contribute approximately 24% of market demand, with annual production exceeding 214 billion units. These products are commonly used for food preservation, sauces, jams, honey, and processed foods. Heat resistance, airtight sealing, and chemical stability enhance product shelf life.
Vials
Glass vials represent nearly 13% of total production, exceeding 116 billion units annually. Pharmaceutical-grade borosilicate glass provides excellent thermal resistance, chemical durability, and sterility, making these containers suitable for injectable drugs and vaccines.
By End-use Industry
Food & Beverage
The food and beverage industry accounts for approximately 69% of global demand, consuming more than 615 billion glass containers annually. Beverage bottling, processed foods, dairy, and condiments maintain adoption rates exceeding 76% in premium product categories, making this the largest application segment.
Pharmaceuticals
Pharmaceutical applications contribute nearly 18% of total demand, utilizing over 160 billion containers annually. Hospitals, vaccine manufacturers, and injectable drug producers continue increasing adoption because of glass's superior chemical stability and contamination resistance.
Personal Care & Cosmetics
Personal care and cosmetics account for approximately 13% of the market, with annual consumption exceeding 115 billion containers. Luxury perfumes, skincare products, and cosmetic formulations increasingly utilize decorative glass packaging to enhance product value and brand positioning.
Container Glass Market Segmentations
Product Type
- Bottles
- Jars
- Vials
End-use Industry
- Food & Beverage
- Pharmaceuticals
- Personal Care & Cosmetics
Container Glass Regional Outlook
North America
North America accounts for approximately 25% of global revenue. The United States contributes nearly 79% of regional production, supported by beverage manufacturing and pharmaceutical packaging. Regional production exceeds 220 billion containers annually, with recycled glass utilization surpassing 38%.
Europe
Europe represents nearly 29% of global demand. Germany, France, Italy, Spain, and the United Kingdom contribute more than 73% of regional production. Annual output exceeds 255 billion containers, supported by strict recycling regulations and sustainable packaging initiatives.
Asia-Pacific
Asia-Pacific dominates with approximately 38% of the global market. China contributes nearly 51% of regional production, followed by India, Japan, and South Korea. Production exceeds 340 billion containers annually, driven by rapid urbanization, food processing expansion, and pharmaceutical manufacturing.
Latin America
Latin America contributes approximately 5% of global demand. Brazil, Mexico, and Argentina collectively account for nearly 72% of regional production, exceeding 45 billion containers annually through expanding beverage manufacturing.
Middle East & Africa
The Middle East & Africa account for nearly 3% of global consumption. Saudi Arabia, the UAE, Egypt, and South Africa remain key manufacturing hubs with annual production exceeding 30 billion containers, supported by growing food and pharmaceutical industries.
Top Players In The Container Glass Market
- O-I Glass, Inc.
- Ardagh Group S.A.
- Verallia SA
- Vidrala S.A.
- BA Glass Group
- Gerresheimer AG
- Vetropack Holding AG
- Piramal Glass Limited
- HEINZ-GLAS GmbH & Co. KGaA
- Stoelzle Glass Group
- Shandong Pharmaceutical Glass Co., Ltd.
- Nihon Yamamura Glass Co., Ltd.
O-I Glass, Inc. Estimated global market share: 17%. Global leader in food, beverage, and pharmaceutical glass packaging. Manufacturing operations across multiple continents with advanced furnace technologies. The company focuses on lightweight container development, high recycled glass utilization, automated inspection systems, and energy-efficient manufacturing. Strong customer relationships with beverage producers, food processors, and pharmaceutical companies enable continued market leadership. O-I Glass continues investing in digital manufacturing, sustainability initiatives, and furnace modernization to improve operational efficiency while reducing carbon emissions across its global production network. Ardagh Group S.A. Estimated global market share: 13% Strong presence across beverage, food, and specialty glass packaging. Extensive production footprint throughout Europe and North America. Ardagh Group continues expanding sustainable manufacturing through lightweight packaging innovation, recycled glass integration, and smart production technologies. Its diversified customer portfolio, continuous investment in premium packaging solutions, and focus on environmentally responsible manufacturing strengthen its competitive position across beverage, pharmaceutical, and personal care industries while supporting long-term operational growth.