Linerless Labels Market Size
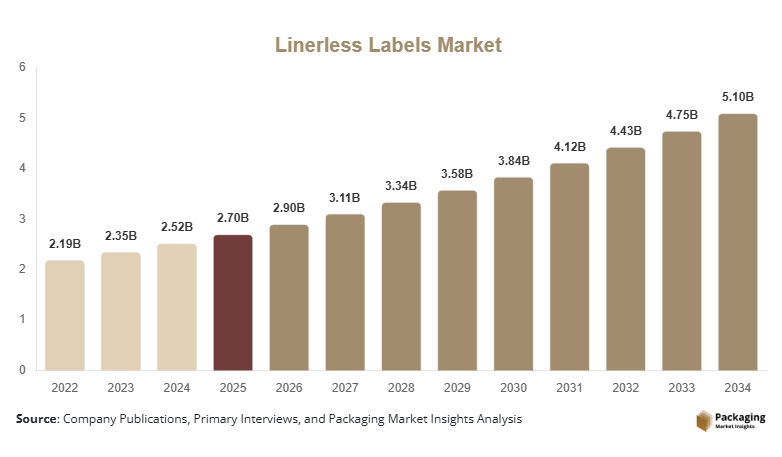
The linerless labels market size is projected at USD 2.9 billion in 2026 and is expected to hit USD 5.1 billion by 2034 with a CAGR of 7.3%. The report analyzes production capacity, consumption trends, pricing structure, competitive landscape, and technological developments across major regions. It also evaluates market segmentation, supply chain dynamics, and strategic initiatives adopted by leading manufacturers.
The linerless labels market consists of pressure-sensitive labels manufactured without a release liner, improving material utilization and reducing packaging waste. Global production exceeded 96 billion labels in 2025 and is projected to surpass 158 billion labels by 2034. Food & beverage applications accounted for nearly 44% of total demand, and logistics & transportation represented 33%, while retail contributed approximately 23%. Automated linerless label printer adoption exceeded 41%, while sustainable packaging implementation crossed 48%, supporting the linerless labels market.
Explore more data points, trends and opportunities Download Free Sample Report
Linerless Labels Market Trends
Growing Adoption of Sustainable Labeling Technologies
Packaging manufacturers continue shifting toward linerless labeling solutions to reduce material waste and improve operational efficiency. Production is projected to increase from 101 billion labels in 2026 to over 160 billion labels by 2034. More than 52% of large packaging companies have incorporated sustainable labeling initiatives, while waste reduction reached approximately 35% compared to conventional labels. These developments continue strengthening the linerless label market.
Advancements in adhesive formulations and print technologies are improving product performance across logistics and retail applications. Digital printing adoption exceeded 46%, while high-speed linerless printing systems recorded annual growth of 14%. More than 38% of manufacturers invested in silicone-free coating technologies, reinforcing long-term expansion of the linerless labels market.
Linerless Labels Market Drivers
Increasing Demand for Sustainable Packaging Solutions
Growing environmental awareness and packaging waste reduction initiatives continue driving adoption of linerless labels. More than 57% of multinational consumer goods companies introduced sustainable packaging programs, while recyclable labeling demand increased by 16% annually. Global production exceeded 96 billion labels, and packaging sustainability investments surpassed USD 3.1 billion, accelerating the linerless labels market.
Linerless Labels Market Restraints
Higher Initial Equipment Investment
Implementation of linerless printing systems requires specialized equipment and compatible dispensing technologies. Initial capital investment increased by approximately 18%, while equipment replacement costs rose by 11%. Small manufacturers continue facing financial barriers despite long-term operational savings within the linerless labels market.
Linerless Labels Market Opportunities
Expansion of E-commerce and Automated Logistics
The rapid growth of e-commerce fulfillment centers continues, creating opportunities for linerless label adoption. Warehouse automation penetration exceeded 54%, while global parcel shipments increased by 13% annually. More than 45 billion logistics labels were consumed across automated distribution facilities during 2025, supporting the linerless-label market.
Challenges in Linerless Labels Market
Maintaining Adhesive Performance Across Multiple Surfaces
Manufacturers continue addressing technical challenges associated with adhesion on corrugated boxes, plastic films, and recycled substrates. Nearly 21% of converters reported compatibility issues with certain packaging materials, while specialty adhesive costs increased by 10%. Continuous innovation remains necessary to maintain product reliability throughout the linerless labels market.
Report Scope
| Report Metric | Details |
|---|---|
| Market Size in 2025 | USD 2.7 Billion |
| Market Size in 2026 | USD 2.9 Billion |
| Market Size in 2034 | USD 5.1 Billion |
| CAGR | 7.3% (2026-2034) |
| Base Year for Estimation | 2025 |
| Historical Data | 2022-2024 |
| Forecast Period | 2026-2034 |
| Report Coverage | Revenue Forecast, Competitive Landscape, Supply Chain Disruption, Growth Factors, Environment & Regulatory Landscape and Trends |
| Geographies Covered | North America, Europe, APAC, Middle East and Africa, LATAM |
| Countries Covered | U.S., Canada, U.K., Germany, France, Spain, Italy, Russia, Nordic, Benelux, Rest of Europe, China, South Korea, Japan, India, Australia, Singapore, Taiwan, South East Asia, Rest of Asia-Pacific, UAE, Turkey, Saudi Arabia, South Africa, Egypt, Nigeria, Rest of MEA, Brazil, Mexico, Argentina, Chile, Colombia, Rest of LATAM |
Explore more data points, trends and opportunities Download Free Sample Report
Linerless Labels Market Segmentation
The market is segmented by label type and application. Permanent linerless labels accounted for approximately 49% of global demand, removable linerless labels represented 29%, and repositionable linerless labels contributed 22% of total production.
By Type
Permanent Linerless Labels: Representing nearly 49% of market demand, production exceeded 47 billion labels annually. These labels provide high adhesive strength, excellent print quality, and reliable performance for logistics and product identification.
Removable Linerless Labels: Holding approximately 29% share, annual production surpassed 28 billion labels. These products enable temporary labeling applications while minimizing residue and improving operational flexibility.
Repositionable Linerless Labels: Accounting for around 22% of production, these labels exceeded 21 billion units annually. Enhanced adhesive technology allows repeated repositioning without compromising label integrity.
By Application
Food & Beverage: Dominating with approximately 44% share, this segment consumed over 42 billion labels annually. Applications include packaged foods, beverages, fresh produce, and prepared meal packaging requiring sustainable labeling.
Logistics & Transportation: Representing nearly 33% of demand, logistics applications utilized more than 32 billion labels annually. Linerless labels improve shipping efficiency, barcode printing, and warehouse operations.
Retail: Holding approximately 23% market share, retail applications consumed over 22 billion labels annually. Product pricing, shelf labeling, and promotional campaigns continue driving demand across supermarkets and retail chains.
Linerless Labels Market Segmentations
Type
- Permanent Linerless Labels
- Removable Linerless Labels
- Repositionable Linerless Labels
Application
- Food & Beverage
- Logistics & Transportation
- Retail
Distribution Channel
- Direct Sales
- Packaging Distributors
- Online Sales
- Industrial Supply Dealers
- Label Converters
Linerless Labels Regional Outlook
North America
North America accounted for approximately 36% of global demand, producing more than 35 billion labels annually. The United States contributed nearly 82% of regional consumption due to advanced logistics infrastructure and high sustainability adoption.
Europe
Europe represented approximately 30% of the market with production exceeding 29 billion labels annually. Germany, France, Italy, and the United Kingdom together accounted for over 73% of regional demand through strict environmental regulations.
Asia-Pacific
The Asia-Pacific captured nearly 27% market share while annual production exceeded 26 billion labels. China, Japan, India, and South Korea dominated regional manufacturing supported by expanding food processing and retail industries.
Latin America
Latin America accounted for approximately 4% of global production. Brazil and Mexico represented nearly 68% of regional demand through increasing logistics and packaged food consumption.
Middle East & Africa
The Middle East & Africa contributed approximately 3% of global demand. GCC countries and South Africa experienced increasing adoption of sustainable packaging and automated labeling systems.
Top Players In The Linerless Labels Market
- Avery Dennison Corporation
- CCL Industries Inc.,
- UPM Raflatac
- 3M Company
- SATO Holdings Corporation
- Zebra Technologies Corporation
- Ravenwood Packaging Ltd.
- Coveris Holdings S.A.
- LINTEC Corporation
- Hub Labels Inc.
- Optimum Group
- R.R. Donnelley & Sons Company
Avery Dennison Corporation Estimated market share: 14%–16% Global leader in pressure-sensitive labeling technologies with a strong linerless product portfolio. Extensive investments in sustainable materials, intelligent labeling, and digital printing technologies. Strong manufacturing footprint across North America, Europe, and Asia-Pacific, serving food, logistics, and retail sectors. Focused on recyclable label innovations and operational efficiency to strengthen long-term market leadership. CCL Industries Inc. Estimated market share: 11%–13% Leading supplier of specialty labeling solutions for consumer goods, logistics, and industrial applications. Broad manufacturing capabilities support customized linerless label production for global customers. Continuous investment in automation, sustainable adhesives, and high-performance printing technologies. Well-established customer relationships and a global distribution network reinforce its competitive position.