Growlers Market Size
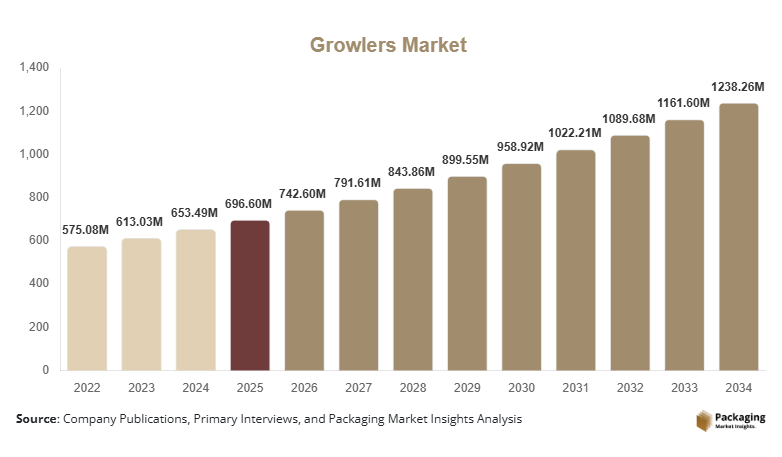
The growlers market size is projected at USD 742.6 million in 2026 and is expected to hit USD 1,236.8 million by 2034 with a CAGR of 6.6%.
The market continues to expand due to increasing demand for reusable beverage containers across breweries, beverage retail outlets, and specialty stores. The report evaluates detailed market segmentation, production statistics, consumption patterns, and the competitive landscape to provide a comprehensive industry assessment for manufacturers, distributors, and investors.
The Growlers Market represents the global industry engaged in manufacturing and supplying reusable containers designed primarily for transporting draft beverages. Global production exceeded 48.3 million units during 2025, while annual shipments reached nearly 46.7 million units with utilization rates above 91%. Glass products contributed approximately 58.4% of total production, stainless steel accounted for 31.2%, and ceramic products represented 10.4%. Commercial brewery adoption surpassed 72%, while specialty beverage retailers recorded penetration above 64%, reinforcing the importance of the growlers market across the beverage packaging industry.
Explore more data points, trends and opportunities Download Free Sample Report
Growlers Market Trends
Rising Preference for Sustainable Beverage Packaging
Manufacturers are increasing production capacity to meet sustainability objectives and reusable packaging initiatives. Annual production is expected to increase from 48.3 million units in 2025 to over 71.5 million units by 2034. Stainless steel growlers witnessed adoption growth of 8.4% annually, while reusable packaging utilization exceeded 68% among independent breweries. Advanced insulation technologies and leak-proof closures continue improving product performance, supporting the growlers market.
Digital customization, laser engraving, and premium branding solutions are becoming increasingly popular among beverage producers. Customized growler production represented nearly 19.6 million units in 2025, while online retail channels generated over 38% of total product sales. Smart manufacturing technologies improved production efficiency by approximately 14%, strengthening overall competitiveness within the Growlers market.
Growlers Market Drivers
Growing Preference for Reusable Beverage Containers
Environmental regulations encouraging reusable packaging continue supporting industry expansion. More than 74% of craft breweries now offer refill programs, while reusable container adoption reduced single-use packaging consumption by approximately 28%. Annual refill transactions exceeded 310 million globally during 2025, supported by expanding beverage retail networks and increasing consumer awareness, driving the growlers market.
Growlers Market Restraints
Availability of Alternative Beverage Packaging
Competition from aluminum cans, PET bottles, and disposable packaging continues limiting industry expansion. Alternative beverage packaging represented nearly 61% of retail beverage distribution during 2025, while transportation costs for glass growlers increased approximately 9.7%. Product breakage rates remained around 3.8% during logistics operations, creating operational challenges for the Growler's Market.
Growlers Market Opportunities
Expansion of Premium Craft Beverage Industry
Growing investments in premium beverages continue generating new business opportunities. More than 9,800 craft breweries operated globally during 2025, while premium beverage consumption increased by 11.6%. Refillable packaging programs expanded by nearly 18%, creating higher demand for insulated and customized growlers across commercial and retail applications, benefiting the growler market.
Challenges in Growlers Market
Supply Chain Volatility and Raw Material Pricing
Manufacturers continue facing fluctuations in glass, stainless steel, and ceramic raw material costs. Glass prices increased approximately 7.2% during 2025, while stainless steel input costs fluctuated by nearly 9.1%. Freight expenses rose over 8%, affecting production planning and inventory optimization throughout the Growlers market.
Report Scope
| Report Metric | Details |
|---|---|
| Market Size in 2025 | USD 696.6 Million |
| Market Size in 2026 | USD 742.6 Million |
| Market Size in 2034 | USD 1,236.8 Million |
| CAGR | 6.6% (2026-2034) |
| Base Year for Estimation | 2025 |
| Historical Data | 2022-2024 |
| Forecast Period | 2026-2034 |
| Report Coverage | Revenue Forecast, Competitive Landscape, Supply Chain Disruption, Growth Factors, Environment & Regulatory Landscape and Trends |
| Geographies Covered | North America, Europe, APAC, Middle East and Africa, LATAM |
| Countries Covered | U.S., Canada, U.K., Germany, France, Spain, Italy, Russia, Nordic, Benelux, Rest of Europe, China, South Korea, Japan, India, Australia, Singapore, Taiwan, South East Asia, Rest of Asia-Pacific, UAE, Turky, Saudi Arabia, South Africa, Egypt, Nigeria, Rest of MEA, Brazil, Mexico, Argentina, Chile, Colombia, Rest of LATAM |
Explore more data points, trends and opportunities Download Free Sample Report
Growlers Market Segmentation
Material and capacity remain the primary segmentation parameters across the industry. Glass products maintained nearly 58.4% market dominance, while the 1–2 liters category represented approximately 47.6% of global shipments due to broad commercial adoption.
By Material
Glass remains the largest product category, with approximately 58.4% share. Annual production exceeded 28.2 million units, offering excellent product visibility, chemical resistance, and recyclability. Standard capacities range from 1 to 2 liters with pressure-resistant construction suitable for beverage storage
Stainless steel accounted for nearly 31.2% of industry volume. Production reached approximately 15.1 million units during 2025. Double-wall vacuum insulation, corrosion resistance, and extended temperature retention continue supporting commercial and outdoor beverage applications.
Ceramic products represented approximately a 10.4% share, with production exceeding 5.0 million units. Decorative finishes, premium branding, and UV protection make ceramic growlers suitable for specialty beverage packaging despite comparatively lower production volumes.
By Capacity
Up to 1 Liter
This segment contributed nearly 24.5% of global demand with production surpassing 11.8 million units. Compact sizes are widely adopted by restaurants, tasting rooms, and limited-volume beverage purchases.
1–2 Liters
Representing approximately 47.6% share, this remains the leading capacity category. Production exceeded 22.9 million units, while adoption among breweries surpassed 76%. Balanced portability and storage efficiency continue supporting widespread utilization.
Above 2 Liters
This category accounted for approximately a 27.9% share, with production reaching over 13.4 million units. Large-capacity containers are increasingly utilized for commercial events, hospitality businesses, and institutional beverage distribution.
Growlers Market Segmentations
Material
- Glass
- Stainless Steel
- Ceramic
Capacity
- Up to 1 Liter
- 1–2 Liters
- Above 2 Liters
Growlers Market Regional Outlook
North America
North America accounted for approximately 41.8% of global revenue during 2025. Production exceeded 20.1 million units, supported primarily by the United States and Canada. Craft breweries represented over 78% of regional demand, while refill programs continued expanding across urban markets.
Europe
Europe contributed nearly a 28.5% share with production surpassing 13.8 million units. Germany, the United Kingdom, France, and Italy remained leading contributors. Premium beverage packaging and sustainability initiatives supported regional expansion.
Asia-Pacific
Asia-Pacific represented approximately 21.7% of industry demand. Production exceeded 10.5 million units, led by China, Japan, Australia, and India. Growing disposable income and expanding premium beverage consumption accelerated regional adoption.
Latin America
Latin America accounted for nearly 4.6% share. Brazil, Mexico, and Argentina remained the leading manufacturing and consumption markets supported by expanding brewery investments.
Middle East & Africa
Middle East & Africa contributed approximately 3.4% of global demand. Commercial hospitality expansion and premium beverage packaging initiatives supported gradual regional development.
Top Players In The Growlers Market
- Hydro Flask
- Stanley
- Miir
- GrowlerWerks
- Klean Kanteen
- DrinkTanks
- YETI Holdings
- S'well
- EcoVessel
- Fifty/Fifty Bottles
- Stanley PMI
- DrinkTanks LLC
- Coleman
- Polar Bottle
- Takeya USA
Hydro Flask
- Estimated industry presence of approximately 12% within premium insulated growlers.
- Strong positioning through stainless steel technology, premium retail distribution, and outdoor lifestyle branding.
- Extensive product portfolio with multiple capacities, vacuum insulation technology, and expanding international sales channels. Continuous investment in reusable packaging innovation strengthens competitive positioning across commercial and consumer applications.
GrowlerWerks
- Estimated market presence of approximately 9%.
- Well positioned in premium beverage dispensing systems and insulated growlers.
- Focuses on premium engineering, pressure-maintaining dispensing technology, and brewery partnerships. Product differentiation through innovative tap systems and durable stainless steel construction supports long-term customer retention and commercial adoption.