Composite Paper Cans Market Size
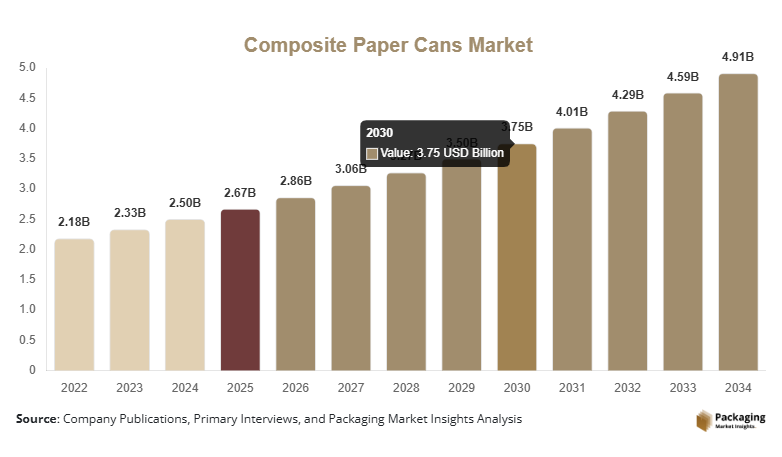
The composite paper cans market size is projected at USD 2.86 billion in 2026 and is expected to hit USD 4.91 billion by 2034 with a CAGR of 7.0%.
The report evaluates historical performance from 2022 to 2024, uses 2025 as the base year, and forecasts the industry through 2034. It provides comprehensive quantitative analysis covering production capacity, end-use demand, technology developments, segmentation, regional performance, and competitive benchmarking to support strategic business planning.
Composite paper cans are multilayer cylindrical packaging solutions manufactured using paperboard, aluminum foil, and polymer barrier materials to provide lightweight, durable, and sustainable packaging for food, beverages, cosmetics, and industrial products. Global production exceeded 19.4 billion units during 2025, while food packaging represented approximately 63% of total demand. Recyclable composite paper cans accounted for nearly 48% of new product launches, reinforcing the composite paper cans market.
Explore more data points, trends and opportunities Download Free Sample Report
Composite Paper Cans Trends
Sustainable Fiber-Based Packaging Accelerates Industry Adoption
Rising environmental regulations and consumer preference for recyclable packaging continue driving innovation. During 2025, production of recyclable composite paper cans exceeded 9.2 billion units, increasing by 24% compared with the previous year. Nearly 58% of packaged snack manufacturers adopted paper-based cylindrical packaging solutions, strengthening the composite paper cans market.
Manufacturers are increasingly incorporating water-based coatings, lightweight barrier materials, and digital printing technologies. More than 61% of newly commissioned production lines integrated automated quality inspection systems, while digital printing adoption increased by approximately 27%. Advanced barrier coatings extended shelf life by nearly 30%, supporting the composite paper can market.
Composite Paper Cans Market Drivers
Growing Demand for Sustainable Food Packaging
The increasing replacement of plastic containers with recyclable paper-based alternatives remains the major growth driver. Global sustainable packaging investments exceeded USD 18 billion during 2025, while packaged food consumption increased by approximately 7.4%. More than 12.3 billion composite paper cans were utilized across food and beverage applications, accelerating the composite paper cans market.
Composite Paper Cans Market Restraints
Fluctuating Raw Material Prices
Volatility in paperboard, aluminum foil, and polymer resin prices continues affecting production costs. Paperboard prices increased by approximately 12%, while specialty barrier materials recorded price growth of nearly 9% during 2025. Manufacturing costs increased by almost 10%, limiting profit margins and restraining the composite paper can market.
Composite Paper Cans Market Opportunities
Expansion of Premium and Functional Packaging
Growing demand for premium packaged foods, nutritional supplements, and eco-friendly cosmetic products creates attractive opportunities. Global premium packaged food sales exceeded USD 430 billion during 2025, while cylindrical paper packaging demand increased by approximately 19%. Smart printing and customized packaging solutions continue creating opportunities for the composite paper cans market.
Challenges in Composite Paper Cans Market
Maintaining Barrier Performance While Improving Recyclability
Manufacturers continue facing challenges balancing high moisture and oxygen barrier performance with recyclable material structures. Approximately 22% of packaging developers are investing in mono-material barrier technologies, while research spending exceeded USD 1.4 billion during 2025. These technological challenges continue influencing the composite paper cans market.
Report Scope
| Report Metric | Details |
|---|---|
| Market Size in 2025 | USD 2.67 Billion |
| Market Size in 2026 | USD 2.86 Billion |
| Market Size in 2034 | USD 4.91 Billion |
| CAGR | 7.0% (2026-2034) |
| Base Year for Estimation | 2025 |
| Historical Data | 2022-2024 |
| Forecast Period | 2026-2034 |
| Report Coverage | Revenue Forecast, Competitive Landscape, Supply Chain Disruption, Growth Factors, Environment & Regulatory Landscape and Trends |
| Geographies Covered | North America, Europe, APAC, Middle East and Africa, LATAM |
| Countries Covered | U.S., Canada, U.K., Germany, France, Spain, Italy, Russia, Nordic, Benelux, Rest of Europe, China, South Korea, Japan, India, Australia, Singapore, Taiwan, South East Asia, Rest of Asia-Pacific, UAE, Turky, Saudi Arabia, South Africa, Egypt, Nigeria, Rest of MEA, Brazil, Mexico, Argentina, Chile, Colombia, Rest of LATAM |
Explore more data points, trends and opportunities Download Free Sample Report
Composite Paper Cans Market Segmentation
The market is segmented by type and application according to manufacturing technology and end-use industries. Spiral-wound composite cans account for approximately 52% of global revenue, while food & beverages contribute nearly 63% of total application demand due to extensive packaged food consumption.
By Type
Spiral-wound composite cans account for approximately 52% of market revenue, with annual production exceeding 10.1 billion units. These cans offer lightweight construction, excellent structural integrity, and cost-effective manufacturing for snacks, beverages, and powdered food products.
Convolute-wound composite cans represent nearly 31% of market demand. Production exceeded 6.0 billion units during 2025, providing enhanced strength, premium appearance, and superior printability for specialty food and cosmetic packaging.
Straight-Walled Composite Cans contribute approximately 17% of global revenue. Annual production surpassed 3.3 billion units, supporting industrial chemicals, adhesives, and premium consumer goods requiring rigid cylindrical packaging.
By Application
Food & beverages dominate with approximately 63% market share. More than 12.3 billion composite paper cans were consumed annually for snacks, powdered beverages, dairy products, coffee, and confectionery packaging while maintaining shelf-life performance exceeding 12 months.
Personal care & cosmetics contribute nearly 21% of market revenue. Production exceeded 4.1 billion packaging units, with premium cosmetic brands increasingly adopting recyclable cylindrical packaging to strengthen sustainability initiatives.
Industrial products account for approximately 16% of market demand. Nearly 3.0 billion composite paper cans were utilized for adhesives, chemicals, powders, and specialty industrial materials requiring moisture-resistant packaging.
Composite Paper Cans Market Segmentations
Type
- Spiral-Wound Composite Cans
- Convolute-Wound Composite Cans
- Straight-Walled Composite Cans
Application
- Food & Beverages
- Personal Care & Cosmetics
- Industrial Products
Composite Paper Cans Market Regional Outlook
North America
North America accounts for approximately 31% of global revenue, with the United States contributing nearly 79% of regional demand. Annual production exceeded 5.8 billion units, supported by packaged food and beverage manufacturers adopting sustainable packaging.
Europe
Europe represents approximately 29% of the market. Germany, France, Italy, and the United Kingdom contribute more than 68% of regional production. Sustainable fiber-based packaging adoption exceeded 57%, supporting regional growth.
Asia-Pacific
Asia-Pacific holds approximately 33% of global revenue and records the fastest expansion. China, India, Japan, and South Korea contribute over 75% of regional manufacturing capacity. Production exceeded 6.5 billion units during 2025.
Latin America
Latin America contributes approximately 4% of global demand. Brazil and Mexico account for nearly 71% of regional consumption due to expanding packaged food and beverage industries.
Middle East & Africa
Middle East & Africa account for approximately 3% of market revenue. Rising packaged food consumption and increasing investment in sustainable packaging contributed annual production exceeding 620 million units during 2025.
Top Players In The Composite Paper Can Market
- Sonoco Products Company
- Smurfit Westrock
- Mondi plc
- Greif Inc.
- Visican Ltd.
- Corex Group
- Caraustar Industries LLC
- Chicago Mailing Tube Co.
- Ace Paper Tube Corporation
- Nagel Paper
- Irwin Packaging Pty Ltd.
- Canfab Packaging Inc.
- Marshall Paper Tube Co.
- Heartland Products Group
- Paper Tubes & Sales Manufacturing Inc.
Sonoco Products Company
- Estimated market share: 14–16%
- Global leader in composite paper can manufacturing.
- Sonoco Products Company offers a broad portfolio of composite paper cans for food, beverage, and industrial applications. The company continues investing in recyclable packaging technologies, lightweight materials, and advanced manufacturing automation while maintaining strong production capabilities across North America, Europe, and Asia-Pacific. Its long-standing partnerships with global consumer goods manufacturers strengthen its competitive position.
Smurfit Westrock
- Estimated market share: 11–13%
- Leading supplier of sustainable paper-based packaging solutions.
- Smurfit Westrock focuses on recyclable fiber packaging, innovative barrier technologies, and premium consumer packaging solutions. The company's global manufacturing network, research investments, and commitment to circular economy initiatives support continued expansion within food, beverage, and personal care packaging markets.